

Answered step by step
Verified Expert Solution
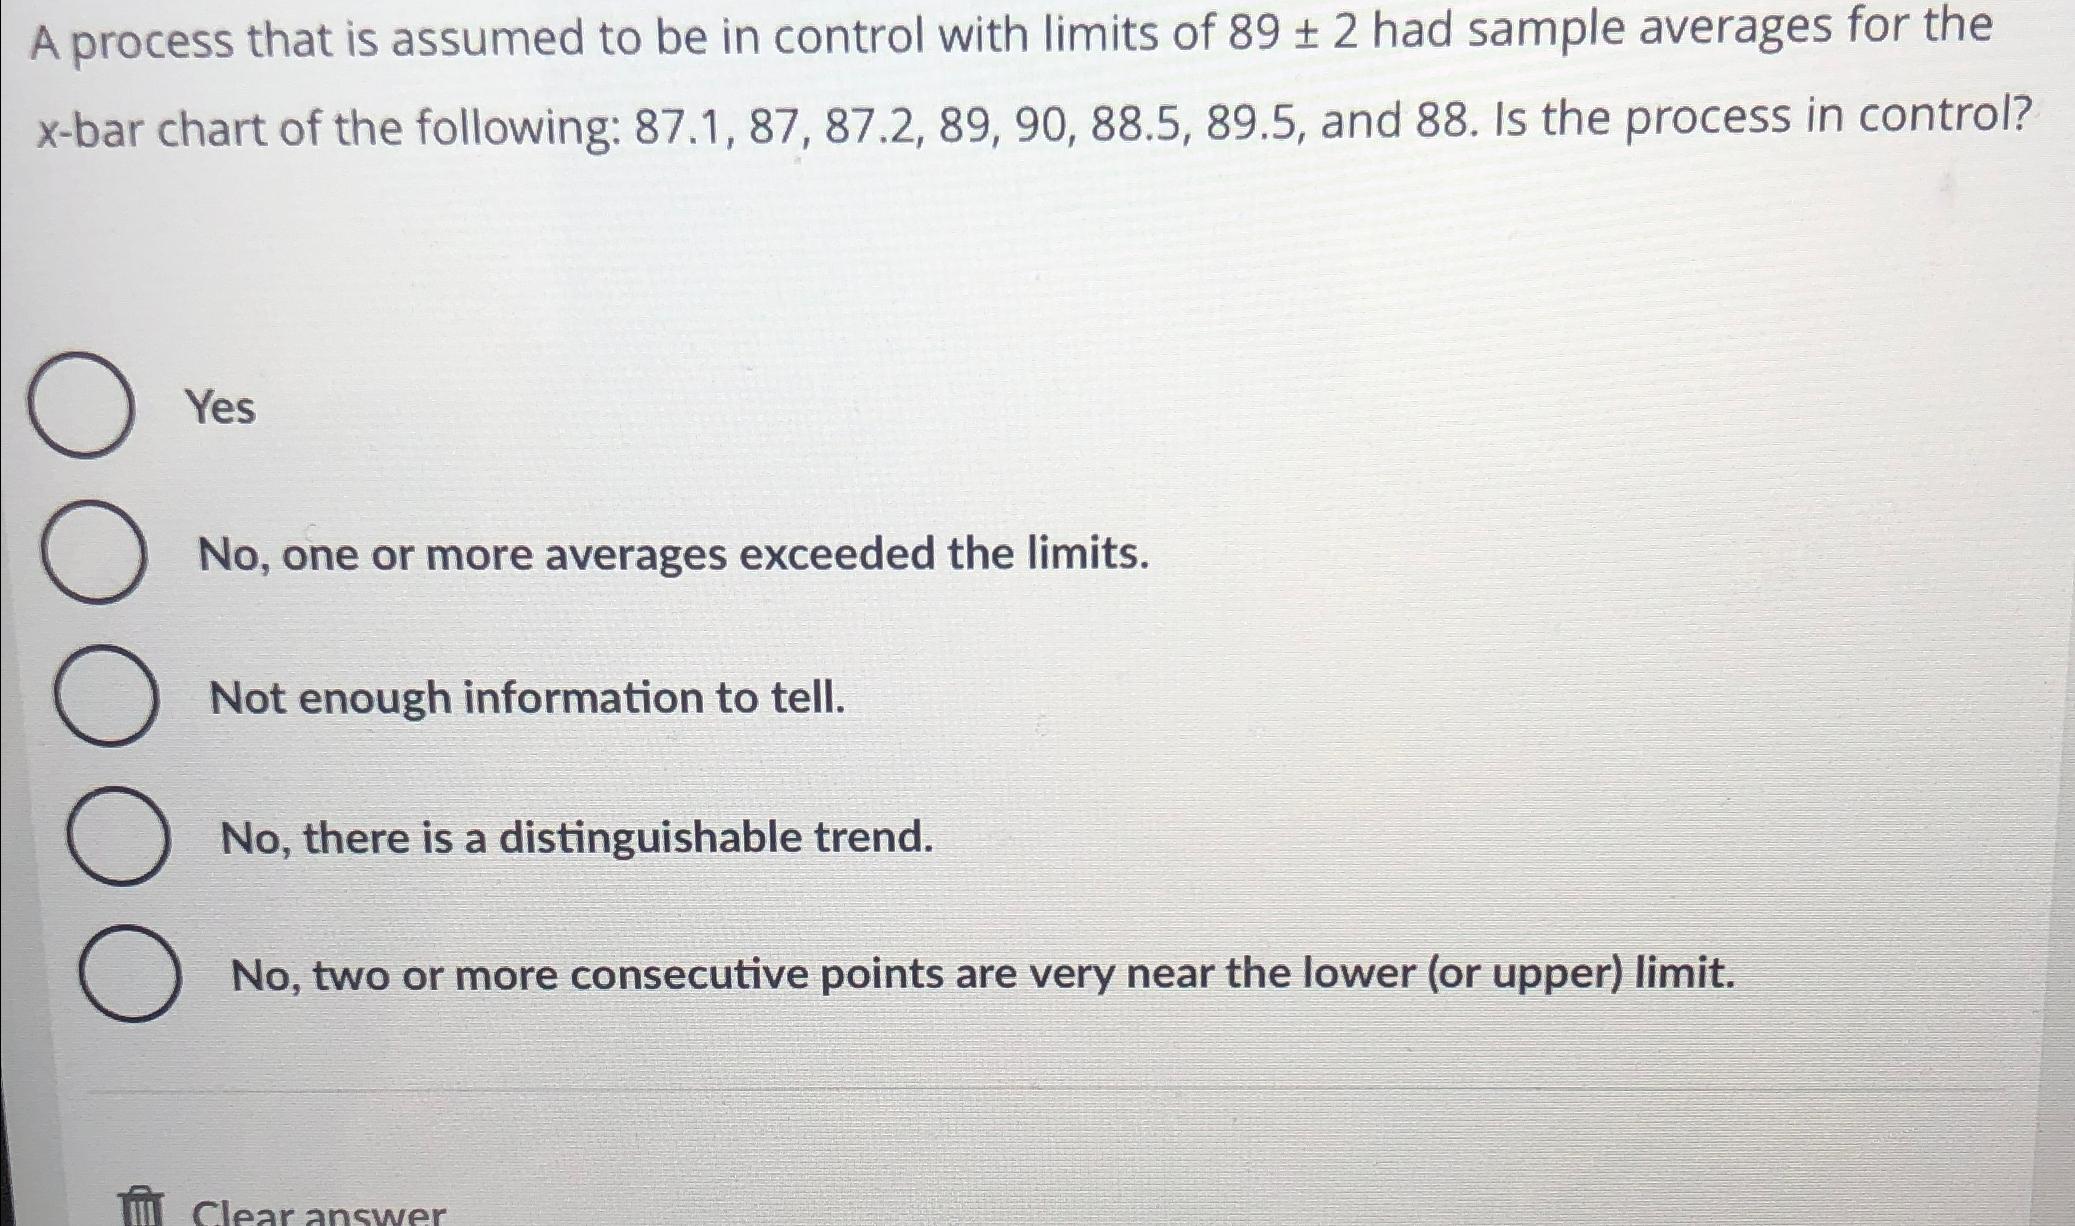
Question
1 Approved Answer
A process that is assumed to be in control with limits of 8 9 + - 2 had sample averages for the x - bar
A process that is assumed to be in control with limits of had sample averages for the xbar chart of the following: and Is the process in control?
Yes
No one or more averages exceeded the limits
Not enough information to tell.
No there is a distinguishable trend.
No two or more consecutive points are very near the lower or upper limit
Step by Step Solution
There are 3 Steps involved in it
Step: 1

Get Instant Access to Expert-Tailored Solutions
See step-by-step solutions with expert insights and AI powered tools for academic success
Step: 2

Step: 3
Ace Your Homework with AI
Get the answers you need in no time with our AI-driven, step-by-step assistance
Get Started
Successful Project Management
Authors: Jack Gido, Jim Clements
4th Edition
9780324656152, 324656130, 978-0324656138