

Answered step by step
Verified Expert Solution
Question
1 Approved Answer
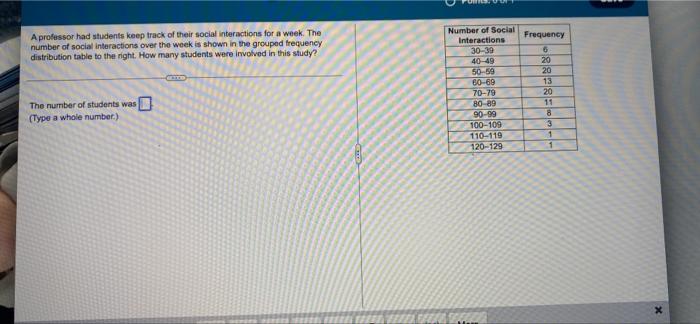
A professor had students keep track of their social interactions for a week. The number of social interactions over the week is shown in the
Step by Step Solution
There are 3 Steps involved in it
Step: 1

Get Instant Access to Expert-Tailored Solutions
See step-by-step solutions with expert insights and AI powered tools for academic success
Step: 2

Step: 3
Ace Your Homework with AI
Get the answers you need in no time with our AI-driven, step-by-step assistance
Get Started
Selected Chapters From Managerial Accounting Creating Value In A Dynamic Business Environment
Authors: Ronald W. Hilton
Edition
0073043346, 978-0073043340