

Answered step by step
Verified Expert Solution
Question
1 Approved Answer
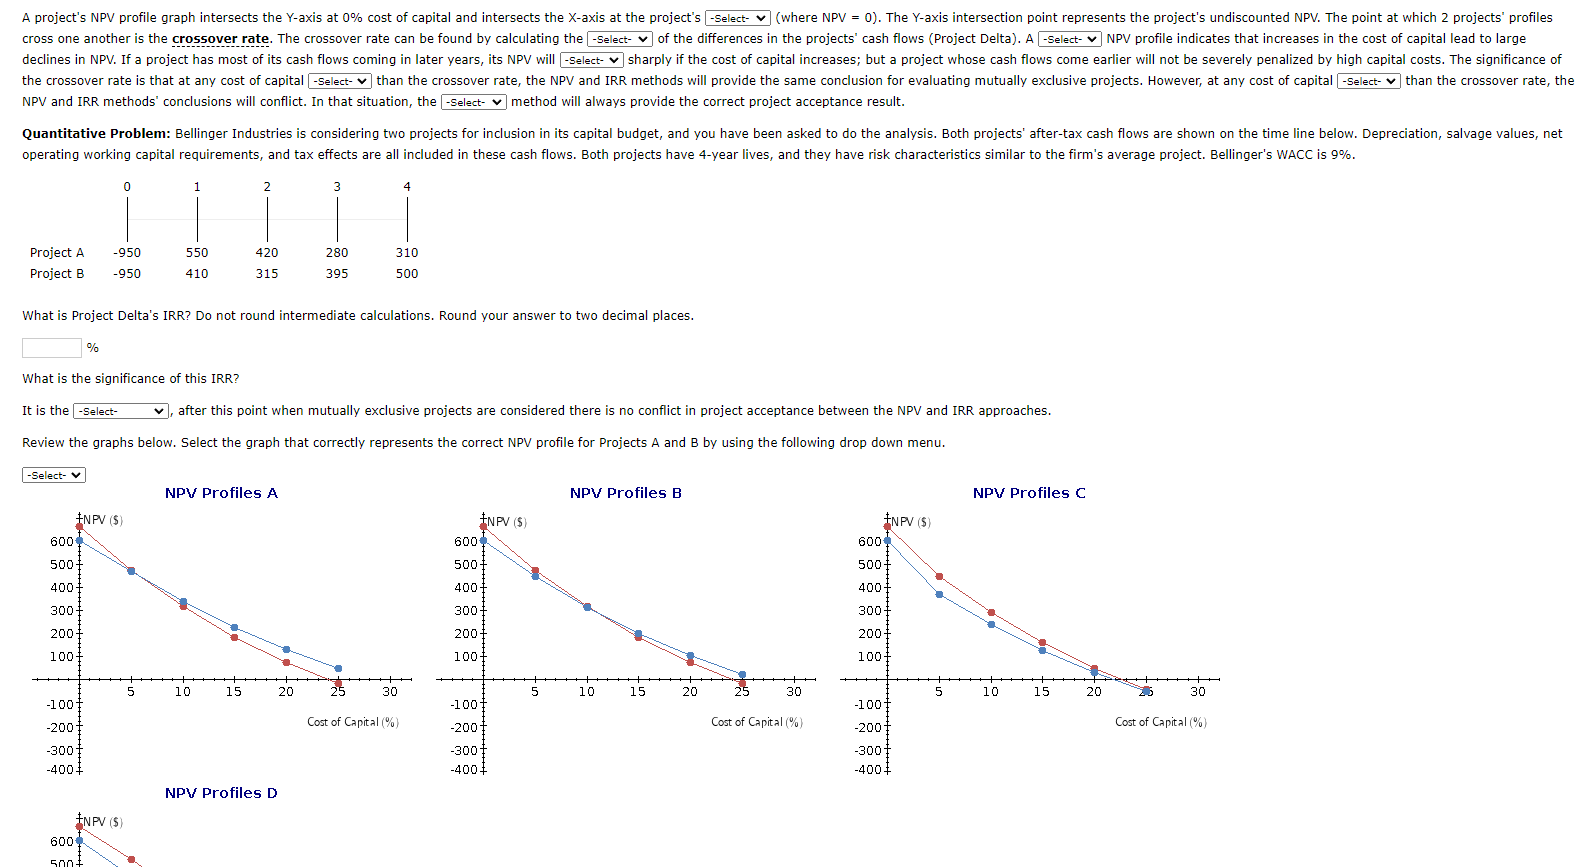
= A project's NPV profile graph intersects the Y-axis at 0% cost of capital and intersects the X-axis at the project's -Select- v (where NPV
Step by Step Solution
There are 3 Steps involved in it
Step: 1

Get Instant Access to Expert-Tailored Solutions
See step-by-step solutions with expert insights and AI powered tools for academic success
Step: 2

Step: 3
Ace Your Homework with AI
Get the answers you need in no time with our AI-driven, step-by-step assistance
Get Started
Offshore Finance And State Power
Authors: Andrea Binder
1st Edition
0192870122, 978-0192870124