

Question
A Promising Start: In the summer of 2016, Photonics, a leader in the production of biometric sensors, started to experience a decline in sales growth
A Promising Start:
In the summer of 2016, Photonics, a leader in the production of biometric sensors, started to experience a decline in sales growth for one of their most popular products, OxyAlert. OxyAlert was launched in 2013 and quickly became the industry standard in analyzing the oxygen levels of surgically repaired tissue after emergency care procedures. In the first year of sales this product captured 25% of the market in post operation biometric devices. By the second year it had rapidly overtaken the industry leader with a 55% share of the market. The success of this product was primarily due to innovative features that were not found on any other product. Features such as wireless disposable sensor probes and advance analytic software allowed doctors to shorten the recovery time of their patients in ICU units, which decreased per patient ICU expense by 10%. Based on these innovative features Photonics was able to charge a premium for this product and establish themselves as one of the most profitable companies in the industry.
Several competitors have now closed the gap in product design and functionality. In the spring of 2016, SeaBridge, one of Photonics biggest rivals, launched the product TotalDiagnostic. This product contains similar disposable sensory technology as OxyAlert, however, it allows doctors to analyze a broader range of a patients biometrics. While this product was priced around 10% higher than OxyAlert, doctors had the added advantage of not only maintaining the same recovery rates but also decrease the rate of post surgical infection by 15%. By the early part of 2017, TotalDiagnostic had captured 30% of the market.
Photonics response was swift. They immediately reduced the price of OxyAlert by 20% in order to regain market share. From March through May, sales of OxyAlert rebounded. While profit margins of the company did take a hit, it appeared that the price reduction stabilized the companys market share. Unfortunately, recent sales reports from June show that pre-orders for OxyAlert are slightly down.
From Research to Commercialization:
Photonics was founded in 2010 by Rachel Walker, a professor of Bioengineering. From 2003 through 2008, Dr. Walker authored several papers on photonic measuring systems and its applications in biometrics. By 2009 she developed a prototype sensor that that was extremely non-invasive to the patient. She realized that this type of sensor combined with advanced computer algorithms could quickly analyze oxygen levels in surgically repaired tissues giving doctors real time information on the likelihood that a patients body would accept or reject the repaired tissue.
Dr. Walker believed that she had an important technology that could be highly profitable if she could find a way to commercialize it. Given the uniqueness of this technology she was able to obtain a patent in 2010. She felt fairly confident that her technology would be a major improvement in post-surgical care. However, several obstacles existed. The cost to turn this technology into a commercialized product was fairly substantial. However, more importantly, this was a highly disrupted technology that would require hospitals to change ICU and post operation processes. She wasnt even sure if hospitals had a desire to change their current practices.
After interviewing several prominent hospital administrators, she concluded that that demand would be high if she could find a way to mass-produce her prototype at a cost that was on par with biometric sensors currently being sold to hospitals and other surgical centers. After several investor presentations, she was able to attract significant funding from a venture capital firm that specialized in funding small biomedical start-ups. With a $15 million dollar investment, Photonics was able to launch its first product, The BMD 1000, in January 2012.
In the first three months of 2012, sales of the BMD 1000 were tepid at best. While the product design was innovative, it did not integrate well with the current technology employed by most hospitals. Based on the criticisms of this product, Dr. Walker and her engineering team went back to the drawing board. The redesigned product was named OxyAlert and was introduced to the industry with much fanfare in January of 2013. By July of 2013, Photonics had secured orders with several large health care facilities on the East Coast. One year later, OxyAlert become the standard in the biometrics device industry.
Cash is King:
In 2016 Photonics posted profits of $20M on net profits margins of 15%, which were above industry averages. Photonics is able to achieve higher profit margins due to the companys unique business model. Photonics has very little long-term capital invested in manufacturing the companys product. Instead it relies on outsourced contract manufactures to produce its product. As a result, the company can easily design and launch new products without the burden of constantly upgrading and retrofitting its manufacturing facilities. The company can also focus on what it does best which is designing and implementing new technologies for its customers. While this business model has allowed the company to dramatically reduce operational cost and increased its flexibility in the market place, it is not without its risk. Because the sales cycle in this industry is long and future sales are difficult to predict, Photonics struggles with managing its supply chain. Contract manufacturers need a steady flow of orders from Photonics in order to stay profitable. To satisfy the needs of its contract manufactures, Photonics carries a larger level of inventory than most of its competitors. Larger levels of on-hand inventory effectively tie up cash. This presents the unique dilemma where the company is highly profitable but struggles to maintain positive cash flow.
Reinventing the business Market Expansion:
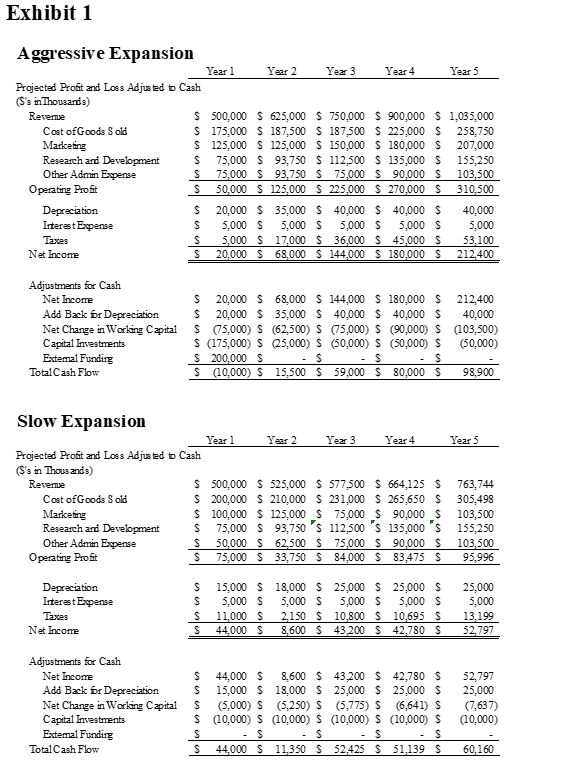
Not only is Dr. Walker nervous about the companys operating business model, she is also worried about the companys growth prospects. While Photonics is a leader in this sector, sales are currently concentrated in the North American market. Geographical expansion into Asian markets will be a top priority in the next year. Exhibit 1 shows the companys five-year profit and loss projections as well as the companys 5-year cash flow projections in two scenarios: Aggressive Asian Expansion with OxyAlert and Slow Asian Expansion with OxyAlert. In the Aggressive Expansion scenario the company will need to raise an additional $200 million dollars preferably through a initial public stock offering (IPO). This funding will be used to support large inventory acquisitions and a new warehouse facility. In the Slow Expansion scenario the CFO estimates that the company can fund its inventory acquisitions and other capital needs with operational cash flow and will not need to rely on external funding.
Reinventing the business New Product Development:
While market expansion is of the outmost importance, Dr. Walker also realizes that the companys current product line will be obsolete in a couple of years. Five years is the typical product life cycle in this industry. Fortunately, the company employs some of the brightest engineers in the field who have been developing three new interesting products that can ensure the companys sales growth. The first product is an improved version of OxyAlert, codenamed OxyAlertII. The second product is completely new to the industry and will allow doctors in emergency rooms to diagnose certain conditions of incapacitated patients through quick blood tests. This product is codenamed AutoAnalytics. The third product is a complimentary product to OxyAlert that will enhance OxyAlerts diagnostic capabilities. This product is codenamed Diagnostic Solutions.
The following are brief descriptions of each products financial costs and revenue projections. For all projects assume a 20% tax rate on net income.
OxyAlertII
The marketing department believes that this product will not completely replace OxyAlert, as there will still be some customers who will want the older and cheaper version. However, they do believe that there could be some sales cannibalization of the old product. In the next five years, sales for OxyAlert are forecasted to steadily decrease by 10% each year in the North American market. First year sales of OxyAlertII are projected to be $50 million with a 15% increase in revenue each year through year 5. In the prior two years the company has spent $10 million to develop this product. To manufacture this new product, Photonics contract manufacturer requires an additional $40 million investment in new equipment purchases. Photonics will agree to pay 100% of this investment and in turn will own the equipment outright. This equipment will have a 5-year life and will depreciate by $8 million per year. With this new equipment the contract manufacturer will be able to produce the product at a lower cost. As a result, Photonics cost of goods sold will be only 30% of revenue, which is much lower than current costs. Incremental administrative and overhead expense will be 35% of revenue. Working capital requirements will be 10% of revenue. In order to successfully launch this product, the marketing department is requesting a one-time advertising budget of $30 million, which will be spent in the first year of sales.
AutoAnalytics
This product is neither a complimentary product nor a replacement product for OxyAlert. The launch of this product is intended to create a new product line by extending Photonics core competencies into the emergency response market. The marketing department forecasts first year revenue at $25 million with initial one time marketing expense of $25 million. Based on projected demand, revenue is expected to increase by 5% year over year for the remaining 4 years. Prior years development cost for this product has totaled $5 million dollars. The contract manufacturer estimates that it will need an additional $10 million dollars in new equipment purchases to manufacture this product. Because the equipment can be repurposed for other customers, Photonics will not pay the contract manufacturer for this equipment and will be owned outright by the contract manufacturer. Because of the lack of experience in manufacturing this type of product, the contract manufacturer expects the cost to make this product will be somewhat high. As a result, cost of goods sold will increase to 45% of revenue. Incremental SG&A will be 25% of revenue with an additional working capital requirement of 15% of revenue.
Diagnostic Solutions
Diagnostic Solutions is a series of networked probes that will allow customers to use OxyAlert in more efficient ways. Marketing believes that this complimentary product will actually help the sales of OxyAlert and prevent the full adoption of its competitors product, TotalDiagnostic, in the marketplace. Market share for OxyAlert is projected to slightly increase by 2 percent over the next 5 years. The finance team believes that this will provide an additional $2 million of cash flow per year in this five-year time period. While this product will help the sales of OxyAlert, it will be sold separately. Revenue projections for Diagnostic Solutions will be $15 million in the first year of sales. Since this is already a fairly saturated market, the sales of Diagnostic Solutions are projected to increase by only 1% per year over the next five years. As this is a complimentary product, the development cost was nominal. The company will, however, need to expand its warehouse facilities. This will require an additional $20 million of capital. The economic useful life of this equipment is 7 years and will depreciate by $2.857 million per year. Incremental cost of goods sold will be in line with current company margins of 43%. Incremental overhead and administrative cost will be 32%. Projected working capital will be 18% of revenue. Given that this is a complimentary product, the company will not incur any additional one time marketing expenses for launching this product.
# Business case questions
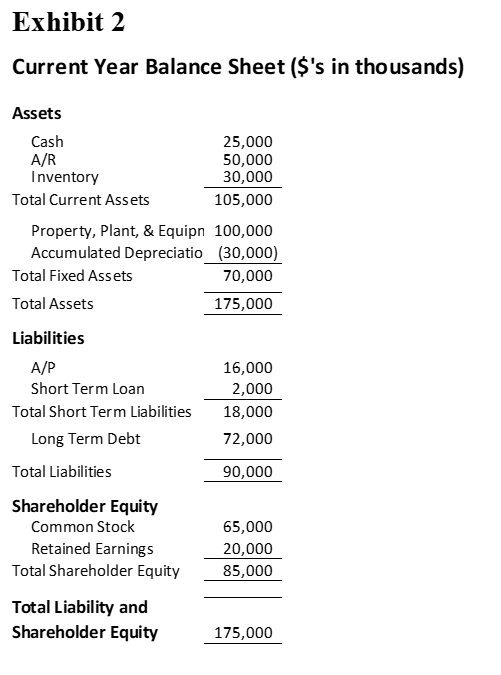
Q1. Using the balance sheet from exhibit 2 and assuming that Photonics cost of raising debt is 7% and the its cost of raising equity is 20% what is the companys weighted average cost of capital?
Q2. Assuming that Photonics has unlimited funding, which products should Photonics launch? Support your recommendation by providing an analysis on each products projected cash flow over a 5-year period and the overall economic value that each product launch provides. You will need to integrate the principles of capital budgeting decision-making in your analysis.
Q3. Based on your analysis from question 2 which product or products would you recommend Photonics launch if Photonics has access to only $50 million dollars of funding? Assume that the $50 million dollars of funding will need to cover the
Exhibit 1 Aggressive Expansion Year 1 Year 2 Year 3 Year 4 Year 5 Projected Profit and Loss Adjusted b Cash S's in Thousands) Reveme $ 500,000 $ 625,000 $750,000 $ 900.000 $ 1,035,000 Cost of Goods Sold $ 175,000 $ 187,500 $ 187,500 $225.000 $ 258,750 Marketing $125,000 $ 125,000 $ 150,000 $ 180,000 $ 207,000 Research and Development $ 75,000 $ 93,750 S 112,500 $ 135,000 $ 155,250 Other Admin Expense $ 75,000 $ 93,750 $ 75,000 $90,000 $ 103.500 Operating Profit $ 50,000 S 125,000 $ 225,000 $ 270,000 $ 310,500 Depreciation $ 20,000 $ 35,000 $40,000 $40,000 $ 40,000 Interest Expense $ 5,000 $ 5,000 $ 5,000 $ 5,000 $ 5,000 Taxes S 5.000 $ 17.000 $ 36,000 $ 45,000 $ 53.100 Net Income $ 20,000 $ 68,000 $144.000 $ 180,000 $ 212,400 Adjustments for Cash Net Income $ 20,000 $ 68,000 $144.000 $ 180.000 $ 212,400 Add Bak br Depreciation $ 20,000 $35.000 $ 40,000 $40.000 $ 40,000 Net Change in Working Capital $ 75,000) $ (62,500) $ 75.000) S (90.000) $ (103,500) Capital Investments $ (175,000) $ 25,000) $ (50.000) S (50.000) $ 650.000) Extemal Funding $ 200,000 $ $ $ S TotalCash Flow S (10,000) S 15,500 $ 59,000 S 80.000 S 98,900 Year 5 Slow Expansion Year 1 Year 2 Year 3 Year 4 Projected Prot and Loss Adju zd b Cash (S's in Thousands) Revenue $ 500,000 $ 525,000 $ 577,500 $ 664,125 $ Cost ofGoods Sold $ 200,000 $ 210,000 $ 231,000 $265.650 $ Marketing $ 100,000 $ 125,000 $ 75,000 $90,000 $ Research and Development S 75,000 $ 93,750 's 112.500 's 135,000's Other Admin Expense $ 50,000 $ 62,500 $ 75,000 $90,000 $ Operating Profit $ 75,000 $ 33,750 S 84.000 S 83,475 S 763,744 305,498 103,500 155,250 103,500 95,996 Depreciation Interest Expense Taxes Net Income S S S $ 15,000 $ 18,000 $25,000 $25,000 $ 5,000 $ 5,000 $ 5,000 $ 5,000 $ 11,000 $ 2,150 $ 10,800 $ 10,695 S 44,000 $ 8,600 S 43,200 $ 42,780 S 25,000 5,000 13,199 52,797 Adjustments for Cash Net Income Add Bk br Depreciation Net Change in Working Capital Capital Investments Extemal Funding Total Cash Flow S 44,000 $ 8,600 $ 43,200 $ 42,780 S S 15,000 $ 18,000 $25,000 $25,000 $ $ (5.000) $ (3,250) S (5,775) $ 6.641) S $ (10,000) S (10,000) $ (10,000) S (10.000) S S $ $ - S - $ S 44.000 $ 11,350 $ 52.425 $ 51.139 S 52,797 25,000 (7,637) (10,000) 60.160 Exhibit 2 Current Year Balance Sheet ($'s in thousands) Assets Cash 25,000 A/R 50,000 Inventory 30,000 Total Current Assets 105,000 Property, Plant, & Equipn 100,000 Accumulated Depreciatio (30,000) Total Fixed Assets 70,000 Total Assets 175,000 16,000 2,000 18,000 72,000 90,000 Liabilities A/P Short Term Loan Total Short Term Liabilities Long Term Debt Total Liabilities Shareholder Equity Common Stock Retained Earnings Total Shareholder Equity Total Liability and Shareholder Equity 65,000 20,000 85,000 175,000 Exhibit 1 Aggressive Expansion Year 1 Year 2 Year 3 Year 4 Year 5 Projected Profit and Loss Adjusted b Cash S's in Thousands) Reveme $ 500,000 $ 625,000 $750,000 $ 900.000 $ 1,035,000 Cost of Goods Sold $ 175,000 $ 187,500 $ 187,500 $225.000 $ 258,750 Marketing $125,000 $ 125,000 $ 150,000 $ 180,000 $ 207,000 Research and Development $ 75,000 $ 93,750 S 112,500 $ 135,000 $ 155,250 Other Admin Expense $ 75,000 $ 93,750 $ 75,000 $90,000 $ 103.500 Operating Profit $ 50,000 S 125,000 $ 225,000 $ 270,000 $ 310,500 Depreciation $ 20,000 $ 35,000 $40,000 $40,000 $ 40,000 Interest Expense $ 5,000 $ 5,000 $ 5,000 $ 5,000 $ 5,000 Taxes S 5.000 $ 17.000 $ 36,000 $ 45,000 $ 53.100 Net Income $ 20,000 $ 68,000 $144.000 $ 180,000 $ 212,400 Adjustments for Cash Net Income $ 20,000 $ 68,000 $144.000 $ 180.000 $ 212,400 Add Bak br Depreciation $ 20,000 $35.000 $ 40,000 $40.000 $ 40,000 Net Change in Working Capital $ 75,000) $ (62,500) $ 75.000) S (90.000) $ (103,500) Capital Investments $ (175,000) $ 25,000) $ (50.000) S (50.000) $ 650.000) Extemal Funding $ 200,000 $ $ $ S TotalCash Flow S (10,000) S 15,500 $ 59,000 S 80.000 S 98,900 Year 5 Slow Expansion Year 1 Year 2 Year 3 Year 4 Projected Prot and Loss Adju zd b Cash (S's in Thousands) Revenue $ 500,000 $ 525,000 $ 577,500 $ 664,125 $ Cost ofGoods Sold $ 200,000 $ 210,000 $ 231,000 $265.650 $ Marketing $ 100,000 $ 125,000 $ 75,000 $90,000 $ Research and Development S 75,000 $ 93,750 's 112.500 's 135,000's Other Admin Expense $ 50,000 $ 62,500 $ 75,000 $90,000 $ Operating Profit $ 75,000 $ 33,750 S 84.000 S 83,475 S 763,744 305,498 103,500 155,250 103,500 95,996 Depreciation Interest Expense Taxes Net Income S S S $ 15,000 $ 18,000 $25,000 $25,000 $ 5,000 $ 5,000 $ 5,000 $ 5,000 $ 11,000 $ 2,150 $ 10,800 $ 10,695 S 44,000 $ 8,600 S 43,200 $ 42,780 S 25,000 5,000 13,199 52,797 Adjustments for Cash Net Income Add Bk br Depreciation Net Change in Working Capital Capital Investments Extemal Funding Total Cash Flow S 44,000 $ 8,600 $ 43,200 $ 42,780 S S 15,000 $ 18,000 $25,000 $25,000 $ $ (5.000) $ (3,250) S (5,775) $ 6.641) S $ (10,000) S (10,000) $ (10,000) S (10.000) S S $ $ - S - $ S 44.000 $ 11,350 $ 52.425 $ 51.139 S 52,797 25,000 (7,637) (10,000) 60.160 Exhibit 2 Current Year Balance Sheet ($'s in thousands) Assets Cash 25,000 A/R 50,000 Inventory 30,000 Total Current Assets 105,000 Property, Plant, & Equipn 100,000 Accumulated Depreciatio (30,000) Total Fixed Assets 70,000 Total Assets 175,000 16,000 2,000 18,000 72,000 90,000 Liabilities A/P Short Term Loan Total Short Term Liabilities Long Term Debt Total Liabilities Shareholder Equity Common Stock Retained Earnings Total Shareholder Equity Total Liability and Shareholder Equity 65,000 20,000 85,000 175,000
Step by Step Solution
There are 3 Steps involved in it
Step: 1

Get Instant Access to Expert-Tailored Solutions
See step-by-step solutions with expert insights and AI powered tools for academic success
Step: 2

Step: 3
Ace Your Homework with AI
Get the answers you need in no time with our AI-driven, step-by-step assistance
Get Started
The House That Bogle Built How John Bogle And Vanguard Reinvented The Mutual Fund Industry
Authors: Lewis Braham
1st Edition
0071749063,0071751157