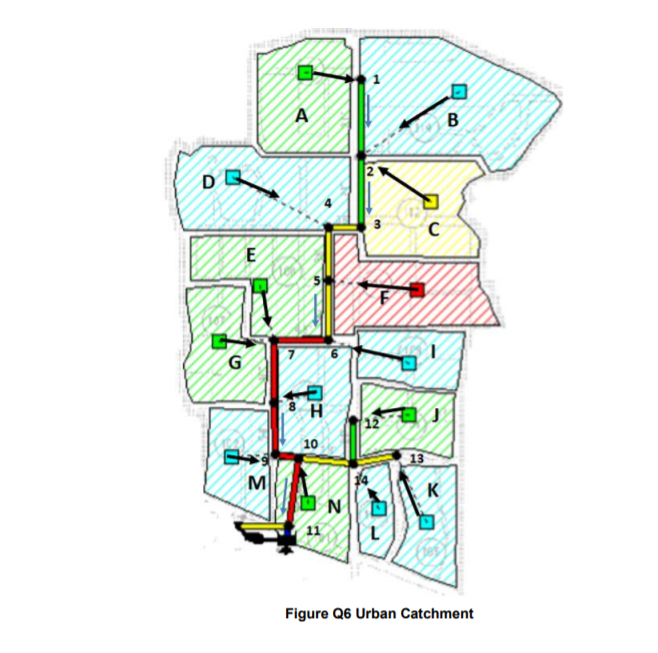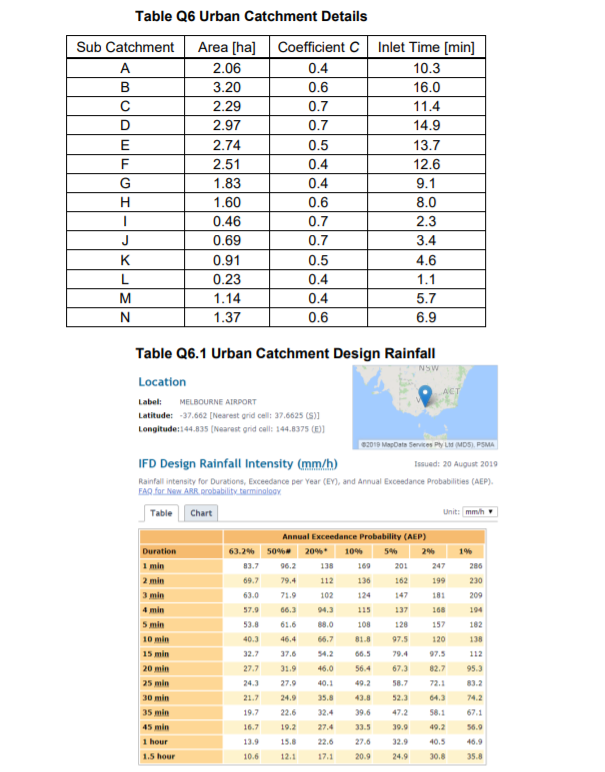


A proposed urban development and stormwater system consists of multiple sub- catchments (indicated by A, B, C...) with details as shown in Figure Q6. Arrows in the figure indicate the direction of flow from each sub-catchment and between Pit Junction Nodes. The Inlet and Junction Pits are indicated by numbers 1, 2, 3... Assume the travel time between the Pit Nodes is 5 minutes. The overland flow travel time (inlet time) from the catchment is given in Table Q6 below. An estimated IFD curve of the 10 % AEP design storm is to be calculated by: 1950 t + 101.05 where i is the average rainfall intensity in mm/hr and t is the duration of the storm in minutes. An actual Bureau of Meteorology IFD Chart is provided in Table 26.1 6 A: Calculate the estimated 10 % AEP design discharge Q10 arriving at pipe 6-7 by the rational method in mst using the IFD formula/equation. 6 B: Calculate the estimated 1 % AEP design discharge Q100 arriving at the catchment outlet also by the rational method in m3 st using the BOM IFD table provided below. 6 C: Using the 10 % AEP design discharge Q10 arriving at pipe 6-7 calculated in Part 6 A, estimate the required pipe diameter to convey the stormwater flow using the Manning equation assuming the pipe will flow full, is to be laid at a slope So of 0.5 % with an appropriate selection of roughness n for concrete pipe. Adjust the final selection to the closest industry standard pipe diameter available. 6 D: Using the 1 % AEP design discharge Q100 arriving at the catchment outlet in Part 6 B, estimate an efficient rip-rap lined trapezoidal channel (best hydraulic section) to convey the stormwater flow to a receiving waterway using the Manning equation. Assuming the channel has a slope So of 0.5%, with a roughness n of 0.04, and allow for an appropriate freeboard. Suggest what could be done to improve this channel design. A B 2 DR E a) 12 10 13 MI ON K Figure Q6 Urban Catchment Table Q6 Urban Catchment Details Sub Catchment A B D E F G H Area [ha] 2.06 3.20 2.29 2.97 2.74 2.51 1.83 1.60 0.46 0.69 0.91 0.23 1.14 1.37 Coefficient Inlet Time [min] 0.4 10.3 0.6 16.0 0.7 11.4 0.7 14.9 0.5 13.7 0.4 12.6 0.4 9.1 0.6 8.0 0.7 2.3 0.7 3.4 0.5 4.6 0.4 1.1 0.4 5.7 0.6 6.9 1 J K L M N Table Q6.1 Urban Catchment Design Rainfall NSW Location Label: MELBOURNE AIRPORT Latitude: -37.662 [Nearest grid cell: 37.6625 (s)] Longitude:144.835 (Nearest grid call: 144.8375 (E)] 02019 MapData Services Pay LM (MDS), PSMA IFD Design Rainfall Intensity (mm/h) Issued: 20 August 2019 Rainfall intensity for Durations, Exceedance per Year (EV), and Annual Exceedance Probabilities (AEP). FAQ for New ABR. Rrobability terminology Table Chart Unit: mmh Annual Exceedance Probability (AEP) Duration 63.2% 50% 20%. 10% 96.2 138 160 201 247 286 2 min 79.4 136 162 230 71.9 102 83.7 69.7 112 199 63.0 147 181 124 115 209 194 57.0 94.3 137 168 157 108 182 88.0 66.7 46.4 120 97.5 79.4 120 53.8 40.3 32.7 27.7 24.3 542 66.5 112 953 46.0 56.4 5 min 10 min 15 min 20 min 25 min 30 min 35 min 45 min 82.7 40.1 72.1 83.2 35.0 21.7 19.7 27.9 24.9 22.6 19.2 58.7 52.3 47.2 39.6 64.3 58.1 49.2 67.1 16.7 27.4 39.9 56.9 27.6 40.5 1 hour 1.5 hour 13.9 10.6 15.8 12.1 46.9 35.8 17.1 20.9 24.9 30.8 A proposed urban development and stormwater system consists of multiple sub- catchments (indicated by A, B, C...) with details as shown in Figure Q6. Arrows in the figure indicate the direction of flow from each sub-catchment and between Pit Junction Nodes. The Inlet and Junction Pits are indicated by numbers 1, 2, 3... Assume the travel time between the Pit Nodes is 5 minutes. The overland flow travel time (inlet time) from the catchment is given in Table Q6 below. An estimated IFD curve of the 10 % AEP design storm is to be calculated by: 1950 t + 101.05 where i is the average rainfall intensity in mm/hr and t is the duration of the storm in minutes. An actual Bureau of Meteorology IFD Chart is provided in Table 26.1 6 A: Calculate the estimated 10 % AEP design discharge Q10 arriving at pipe 6-7 by the rational method in mst using the IFD formula/equation. 6 B: Calculate the estimated 1 % AEP design discharge Q100 arriving at the catchment outlet also by the rational method in m3 st using the BOM IFD table provided below. 6 C: Using the 10 % AEP design discharge Q10 arriving at pipe 6-7 calculated in Part 6 A, estimate the required pipe diameter to convey the stormwater flow using the Manning equation assuming the pipe will flow full, is to be laid at a slope So of 0.5 % with an appropriate selection of roughness n for concrete pipe. Adjust the final selection to the closest industry standard pipe diameter available. 6 D: Using the 1 % AEP design discharge Q100 arriving at the catchment outlet in Part 6 B, estimate an efficient rip-rap lined trapezoidal channel (best hydraulic section) to convey the stormwater flow to a receiving waterway using the Manning equation. Assuming the channel has a slope So of 0.5%, with a roughness n of 0.04, and allow for an appropriate freeboard. Suggest what could be done to improve this channel design. A B 2 DR E a) 12 10 13 MI ON K Figure Q6 Urban Catchment Table Q6 Urban Catchment Details Sub Catchment A B D E F G H Area [ha] 2.06 3.20 2.29 2.97 2.74 2.51 1.83 1.60 0.46 0.69 0.91 0.23 1.14 1.37 Coefficient Inlet Time [min] 0.4 10.3 0.6 16.0 0.7 11.4 0.7 14.9 0.5 13.7 0.4 12.6 0.4 9.1 0.6 8.0 0.7 2.3 0.7 3.4 0.5 4.6 0.4 1.1 0.4 5.7 0.6 6.9 1 J K L M N Table Q6.1 Urban Catchment Design Rainfall NSW Location Label: MELBOURNE AIRPORT Latitude: -37.662 [Nearest grid cell: 37.6625 (s)] Longitude:144.835 (Nearest grid call: 144.8375 (E)] 02019 MapData Services Pay LM (MDS), PSMA IFD Design Rainfall Intensity (mm/h) Issued: 20 August 2019 Rainfall intensity for Durations, Exceedance per Year (EV), and Annual Exceedance Probabilities (AEP). FAQ for New ABR. Rrobability terminology Table Chart Unit: mmh Annual Exceedance Probability (AEP) Duration 63.2% 50% 20%. 10% 96.2 138 160 201 247 286 2 min 79.4 136 162 230 71.9 102 83.7 69.7 112 199 63.0 147 181 124 115 209 194 57.0 94.3 137 168 157 108 182 88.0 66.7 46.4 120 97.5 79.4 120 53.8 40.3 32.7 27.7 24.3 542 66.5 112 953 46.0 56.4 5 min 10 min 15 min 20 min 25 min 30 min 35 min 45 min 82.7 40.1 72.1 83.2 35.0 21.7 19.7 27.9 24.9 22.6 19.2 58.7 52.3 47.2 39.6 64.3 58.1 49.2 67.1 16.7 27.4 39.9 56.9 27.6 40.5 1 hour 1.5 hour 13.9 10.6 15.8 12.1 46.9 35.8 17.1 20.9 24.9 30.8


