Answered step by step
Verified Expert Solution
Question
1 Approved Answer
A pyridine-water solution, 50 wt% pyridine, is to be continuously and countercurrently extracted at the rate of 2.25 kg/s with pure chlorobenzene to reduce

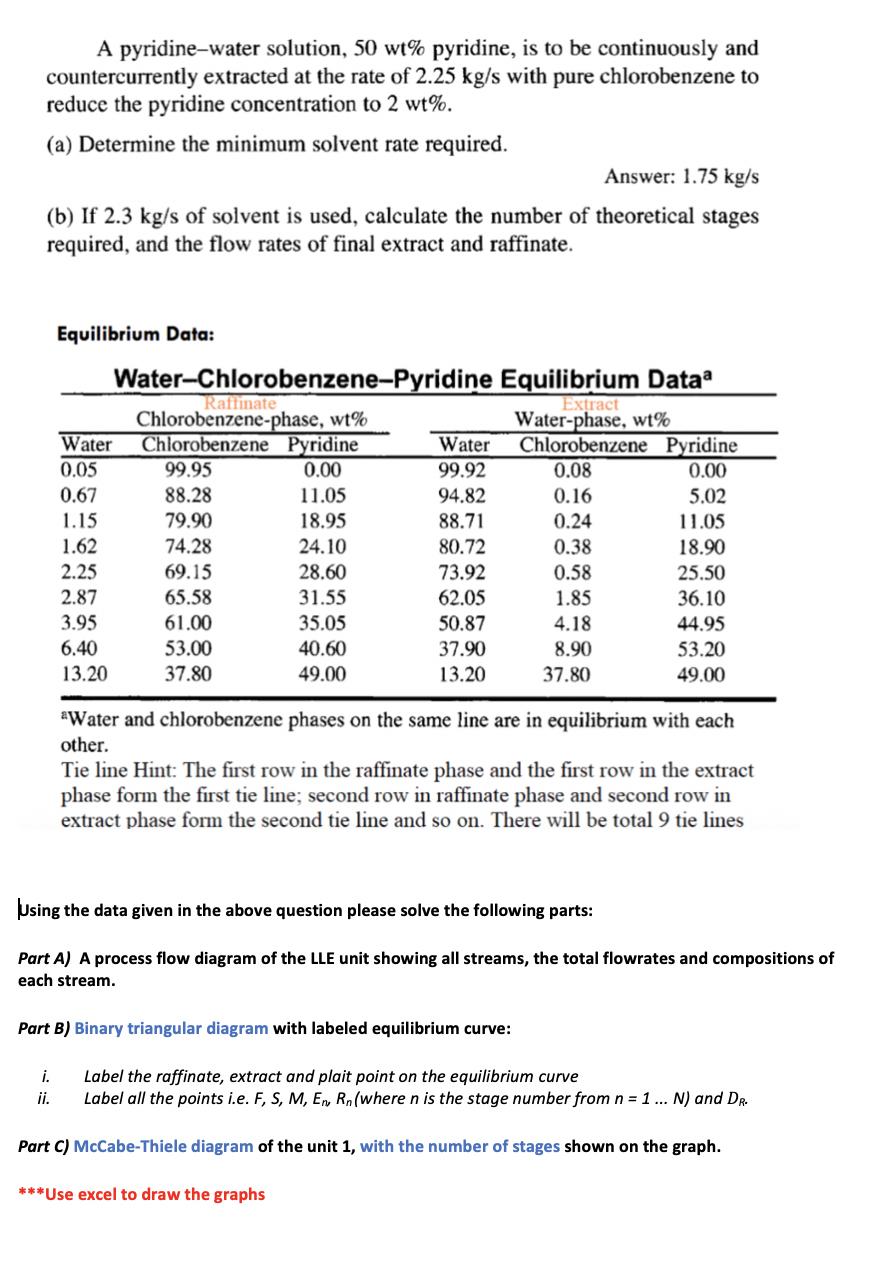
A pyridine-water solution, 50 wt% pyridine, is to be continuously and countercurrently extracted at the rate of 2.25 kg/s with pure chlorobenzene to reduce the pyridine concentration to 2 wt%. (a) Determine the minimum solvent rate required. Answer: 1.75 kg/s (b) If 2.3 kg/s of solvent is used, calculate the number of theoretical stages required, and the flow rates of final extract and raffinate. Equilibrium Data: Water-Chlorobenzene-Pyridine Equilibrium Dataa Raffinate Chlorobenzene-phase, wt% Extract Water-phase, wt% Water Chlorobenzene Pyridine Water Chlorobenzene Pyridine 0.05 99.95 0.00 99.92 0.08 0.00 0.67 88.28 11.05 94.82 0.16 5.02 1.15 79.90 18.95 88.71 0.24 11.05 1.62 74.28 24.10 80.72 0.38 18.90 2.25 69.15 28.60 73.92 0.58 25.50 2.87 65.58 31.55 62.05 1.85 36.10 3.95 61.00 35.05 50.87 4.18 44.95 6.40 53.00 40.60 37.90 8.90 53.20 13.20 37.80 49.00 13.20 37.80 49.00 *Water and chlorobenzene phases on the same line are in equilibrium with each other. Tie line Hint: The first row in the raffinate phase and the first row in the extract phase form the first tie line; second row in raffinate phase and second row in extract phase form the second tie line and so on. There will be total 9 tie lines Using the data given in the above question please solve the following parts: Part A) A process flow diagram of the LLE unit showing all streams, the total flowrates and compositions of each stream. Part B) Binary triangular diagram with labeled equilibrium curve: i. Label the raffinate, extract and plait point on the equilibrium curve ii. Label all the points i.e. F, S, M, En Rn (where n is the stage number from n = 1 ... N) and DR. Part C) McCabe-Thiele diagram of the unit 1, with the number of stages shown on the graph. ***Use excel to draw the graphs
Step by Step Solution
★★★★★
3.51 Rating (161 Votes )
There are 3 Steps involved in it
Step: 1
valuey So by putting 1105 y 1105 ty 2 00L vales in the ...
Get Instant Access to Expert-Tailored Solutions
See step-by-step solutions with expert insights and AI powered tools for academic success
Step: 2

Step: 3

Ace Your Homework with AI
Get the answers you need in no time with our AI-driven, step-by-step assistance
Get Started


