Answered step by step
Verified Expert Solution
Link Copied!

Question

1 Approved Answer

A quality engineer collected process data for 10 subgroups with each subgroup consisting of three samples (n=3). The averages and ranges of samples in each
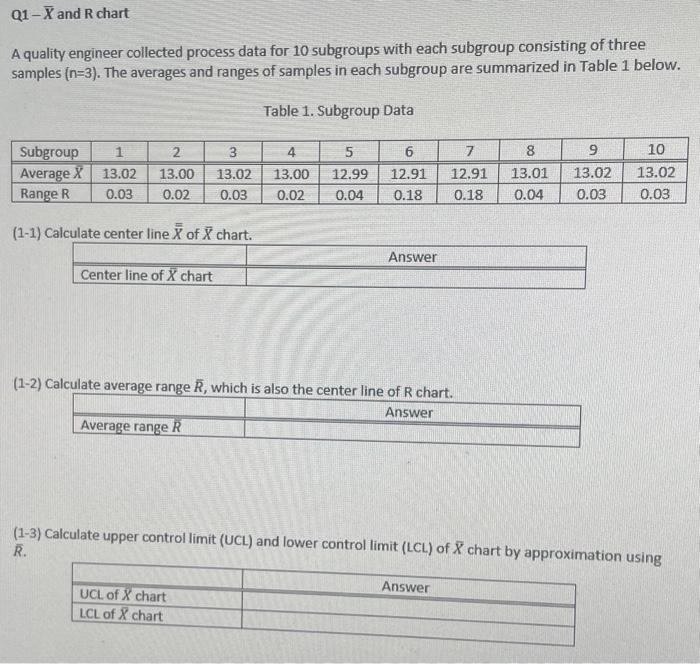
image text in transcribed
A quality engineer collected process data for 10 subgroups with each subgroup consisting of three samples (n=3). The averages and ranges of samples in each subgroup are summarized in Table 1 below. Table 1. Subgroup Data (1-1) Calculate center line X of X chart. (1-2) Calculate average range R, which is also the rontar lino nf D chnot (1-3) Calculate upper control limit (UCL) and lower control limit (LCL) of X chart by approximation using

Step by Step Solution

There are 3 Steps involved in it

Step: 1

blur-text-image

Get Instant Access to Expert-Tailored Solutions

See step-by-step solutions with expert insights and AI powered tools for academic success

Step: 2

blur-text-image

Step: 3

blur-text-image

Ace Your Homework with AI

Get the answers you need in no time with our AI-driven, step-by-step assistance

Get Started

Recommended Textbook for

Manufacturing Planning And Control For Supply Chain Management

Authors: F. Robert Jacobs, William Berry, David Clay Whybark, Thomas Vollmann

6th Edition

0073377821, 9780073377827

More Books

Students also viewed these General Management questions

Question

8 How should the answers to unstructured questions be recorded?

Answered: 1 week ago