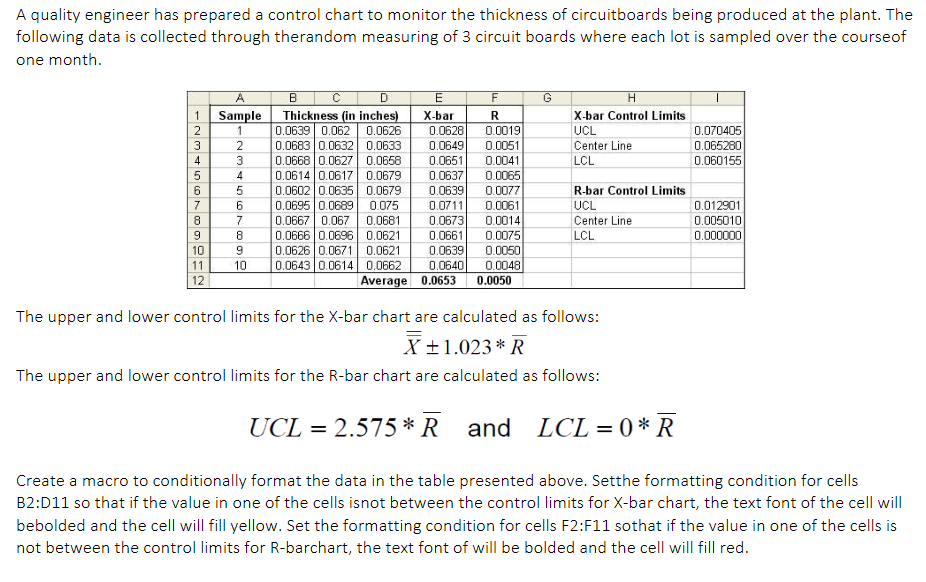
A quality engineer has prepared a control chart to monitor the thickness of circuitboards being produced at the plant. The following data is collected through therandom measuring of 3 circuit boards where each lot is sampled over the courseof one month. G . X-bar Control Limits UCL Center Line LCL 0.070405 0.065280 0.060155 1 2 3 4 5 6 7 8 9 10 11 12 A B D E Sample Thickness (in inches) X-bar 1 0.0639 0.062 0.0626 0.0628 0.0683 0.0632 0.0633 0.0649 0.0668 0.0627 0.0658 0.0651 4 0.0614 0.0617 0.0679 0.0637 5 0.0602 0.0635 0.0679 0.0639 6 0.0695 0.0689 0.075 0.0711 7 0.0667 0.067 0.0681 0.0673 8 0.0666 0.0696 0.0621 0.0661 9 0.0626 0.0671 0.0621 0.0639 10 0.0643 0.0614 0.0662 0.0640 Average 0.0653 NM LONDO) F R 0.0019 0.0051 0.0041 0.0065 0.0077 0.0061 0.0014 0.0075 0.0050 0.0048 0.0050 R-bar Control Limits UCL Center Line LCL 0.012901 0.005010 0.000000 The upper and lower control limits for the X-bar chart are calculated as follows: +1.023 * R The upper and lower control limits for the R-bar chart are calculated as follows: UCL = 2.575* R and LCL = () * R Create a macro to conditionally format the data in the table presented above. Setthe formatting condition for cells B2:011 so that if the value in one of the cells isnot between the control limits for X-bar chart, the text font of the cell will bebolded and the cell will fill yellow. Set the formatting condition for cells F2:F11 sothat if the value in one of the cells is not between the control limits for R-barchart, the text font of will be bolded and the cell will fill red. A quality engineer has prepared a control chart to monitor the thickness of circuitboards being produced at the plant. The following data is collected through therandom measuring of 3 circuit boards where each lot is sampled over the courseof one month. G . X-bar Control Limits UCL Center Line LCL 0.070405 0.065280 0.060155 1 2 3 4 5 6 7 8 9 10 11 12 A B D E Sample Thickness (in inches) X-bar 1 0.0639 0.062 0.0626 0.0628 0.0683 0.0632 0.0633 0.0649 0.0668 0.0627 0.0658 0.0651 4 0.0614 0.0617 0.0679 0.0637 5 0.0602 0.0635 0.0679 0.0639 6 0.0695 0.0689 0.075 0.0711 7 0.0667 0.067 0.0681 0.0673 8 0.0666 0.0696 0.0621 0.0661 9 0.0626 0.0671 0.0621 0.0639 10 0.0643 0.0614 0.0662 0.0640 Average 0.0653 NM LONDO) F R 0.0019 0.0051 0.0041 0.0065 0.0077 0.0061 0.0014 0.0075 0.0050 0.0048 0.0050 R-bar Control Limits UCL Center Line LCL 0.012901 0.005010 0.000000 The upper and lower control limits for the X-bar chart are calculated as follows: +1.023 * R The upper and lower control limits for the R-bar chart are calculated as follows: UCL = 2.575* R and LCL = () * R Create a macro to conditionally format the data in the table presented above. Setthe formatting condition for cells B2:011 so that if the value in one of the cells isnot between the control limits for X-bar chart, the text font of the cell will bebolded and the cell will fill yellow. Set the formatting condition for cells F2:F11 sothat if the value in one of the cells is not between the control limits for R-barchart, the text font of will be bolded and the cell will fill red


