Answered step by step
Verified Expert Solution
Question
1 Approved Answer
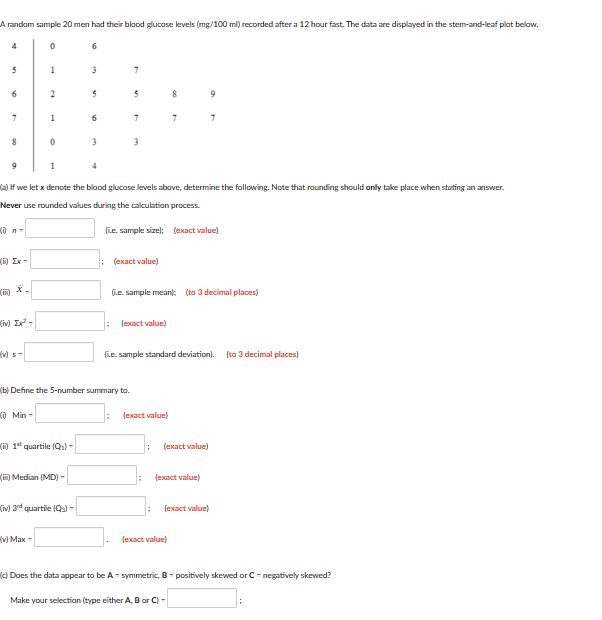
A random sample 20 men had their blood glucose levels (mg/100 ml) recorded after a 12 hour fast. The data are displayed in the

A random sample 20 men had their blood glucose levels (mg/100 ml) recorded after a 12 hour fast. The data are displayed in the stem-and-leaf plot below. 4 0 6 5 1 3 7 6 2 5 5 8 7 1 6 7 7 8 0 3 3 9 1 4 (a) If we let x denote the blood glucose levels above, determine the following. Note that rounding should only take place when stating an answer. Never use rounded values during the calculation process. (n- (ie. sample size); (exact value) ixx- :(exact value) x(iv) Ix- (.e. sample mean): (to 3 decimal places) (exact value) (v) - (ie. sample standard deviation). (to 3 decimal places) (b) Define the 5-number summary to. Min- (i) 1st quartile (Q1)- (exact value) (exact value) (i) Median (MD) - (exact value) (iv) 3rd quartile (Qs) - (exact value) (v) Max- (exact value) (c) Does the data appear to be A-symmetric, B-positively skewed or C - negatively skewed? Make your selection (type either A, B or C) -
Step by Step Solution
There are 3 Steps involved in it
Step: 1

Get Instant Access to Expert-Tailored Solutions
See step-by-step solutions with expert insights and AI powered tools for academic success
Step: 2

Step: 3

Ace Your Homework with AI
Get the answers you need in no time with our AI-driven, step-by-step assistance
Get Started


