

Answered step by step
Verified Expert Solution
Question
1 Approved Answer
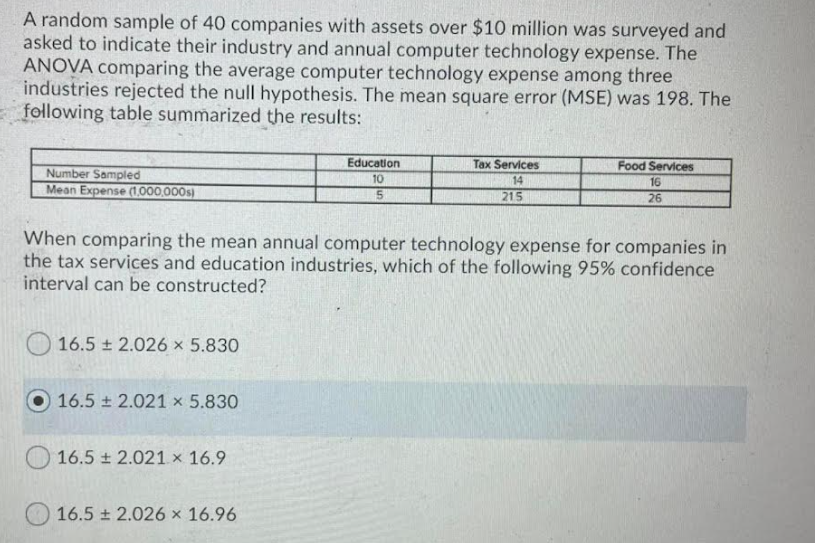
A random sample of 40 companies with assets over $10 million was surveyed and asked to indicate their industry and annual computer technology expense. The
Step by Step Solution
There are 3 Steps involved in it
Step: 1

Get Instant Access to Expert-Tailored Solutions
See step-by-step solutions with expert insights and AI powered tools for academic success
Step: 2

Step: 3
Ace Your Homework with AI
Get the answers you need in no time with our AI-driven, step-by-step assistance
Get Started
Algebra And Trigonometry Enhanced With Graphing Utilities (Subscription)
Authors: Michael, Michael Sullivan III, Michael III Sullivan, Michael Sullivan 111, III Sullivan
6th Edition
0321849132, 9780321849137