Answered step by step
Verified Expert Solution
Question
1 Approved Answer
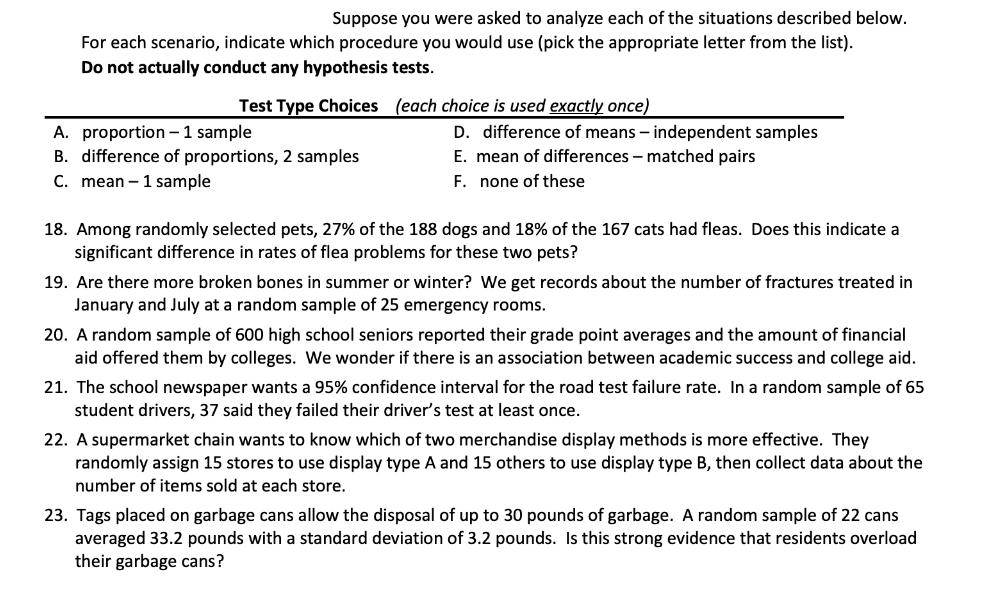
Suppose you were asked to analyze each of the situations described below. For each scenario, indicate which procedure you would use (pick the appropriate

Suppose you were asked to analyze each of the situations described below. For each scenario, indicate which procedure you would use (pick the appropriate letter from the list). Do not actually conduct any hypothesis tests. Test Type Choices (each choice is used exactly once) D. difference of means - independent samples A. proportion - 1 sample B. difference of proportions, 2 samples C. mean - 1 sample E. mean of differences - matched pairs F. none of these 18. Among randomly selected pets, 27% of the 188 dogs and 18% of the 167 cats had fleas. Does this indicate a significant difference in rates of flea problems for these two pets? 19. Are there more broken bones in summer or winter? We get records about the number of fractures treated in January and July at a random sample of 25 emergency rooms. 20. A random sample of 600 high school seniors reported their grade point averages and the amount of financial aid offered them by colleges. We wonder if there is an association between academic success and college aid. 21. The school newspaper wants a 95% confidence interval for the road test failure rate. In a random sample of 65 student drivers, 37 said they failed their driver's test at least once. 22. A supermarket chain wants to know which of two merchandise display methods is more effective. They ndomly assign 5 stores to use display type A and 15 hers to use display type B, then collect data about the number of items sold at each store. 23. Tags placed on garbage cans allow the disposal of up to 30 pounds of garbage. A random sample of 22 cans averaged 33.2 pounds with a standard deviation of 3.2 pounds. Is this strong evidence that residents overload their garbage cans?
Step by Step Solution
★★★★★
3.46 Rating (143 Votes )
There are 3 Steps involved in it
Step: 1

Get Instant Access to Expert-Tailored Solutions
See step-by-step solutions with expert insights and AI powered tools for academic success
Step: 2

Step: 3

Ace Your Homework with AI
Get the answers you need in no time with our AI-driven, step-by-step assistance
Get Started


