

Answered step by step
Verified Expert Solution
Question
1 Approved Answer
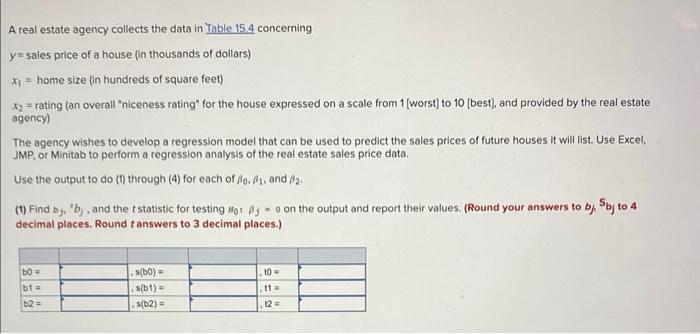
A real estate agency collects the data in Table 15.4 concerning y= sales price of a house (in thousands of dollars) x1= home size (in
Step by Step Solution
There are 3 Steps involved in it
Step: 1

Get Instant Access to Expert-Tailored Solutions
See step-by-step solutions with expert insights and AI powered tools for academic success
Step: 2

Step: 3
Ace Your Homework with AI
Get the answers you need in no time with our AI-driven, step-by-step assistance
Get Started
Behavioral Finance And Investor Types
Authors: Michael M. Pompian
1st Edition
1118011503, 978-1118011508