Answered step by step
Verified Expert Solution
Link Copied!

Question

1 Approved Answer

A realtor collected the following data for a random sample of ten homes that recently sold in her area. 1) (2 points) Using a scatterplot,
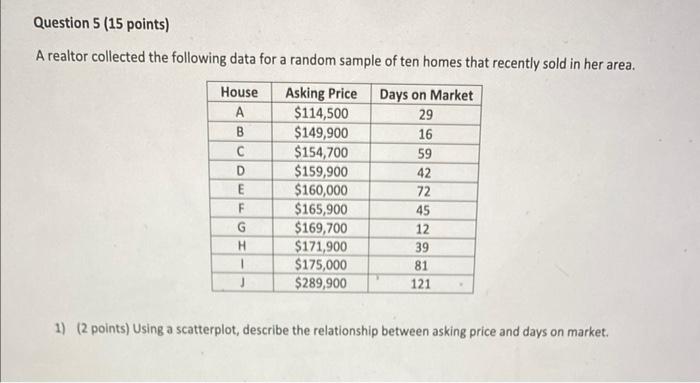
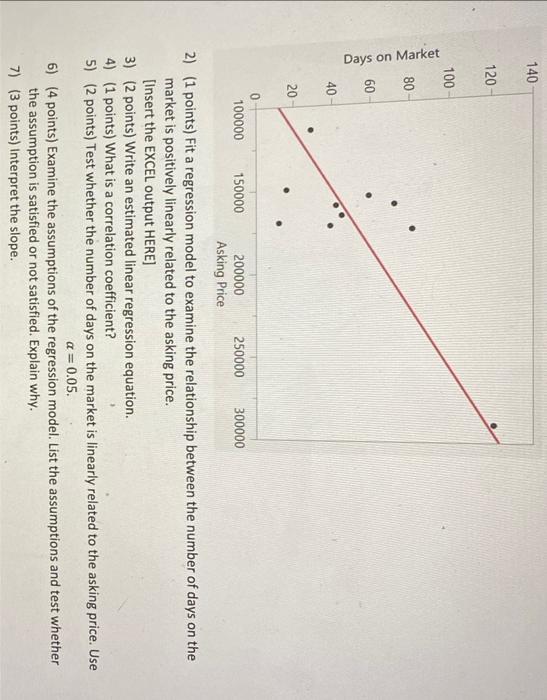
image text in transcribed
A realtor collected the following data for a random sample of ten homes that recently sold in her area. 1) (2 points) Using a scatterplot, describe the relationship between asking price and days on market. 2) (1 points) Fit a regression model to examine the relationship between the number of days on the market is positively linearly related to the asking price. [Insert the EXCEL output HERE] 3) (2 points) Write an estimated linear regression equation. 4) (1 points) What is a correlation coefficient? 5) ( 2 points) Test whether the number of days on the market is linearly related to the asking price. Use =0.05. 6) (4 points) Examine the assumptions of the regression model. List the assumptions and test whether the assumption is satisfied or not satisfied. Explain why. 7) (3 points) Interpret the slope

Step by Step Solution

There are 3 Steps involved in it

Step: 1

blur-text-image

Get Instant Access to Expert-Tailored Solutions

See step-by-step solutions with expert insights and AI powered tools for academic success

Step: 2

blur-text-image_2

Step: 3

blur-text-image_3

Ace Your Homework with AI

Get the answers you need in no time with our AI-driven, step-by-step assistance

Get Started

Recommended Textbook for

Real Life Money An Honest Guide To Taking Control Of Your Finances

Authors: Clare Seal

1st Edition

1472272293, 978-1472272294

More Books

Students also viewed these Finance questions

Question

What lessons in intervention design, does this case represent?

Answered: 1 week ago