Question
A realtor collected the following data for a random sample of ten homes that recently sold in her area. House Asking Price Days on Market
A realtor collected the following data for a random sample of ten homes that recently sold in her area.
| House | Asking Price | Days on Market |
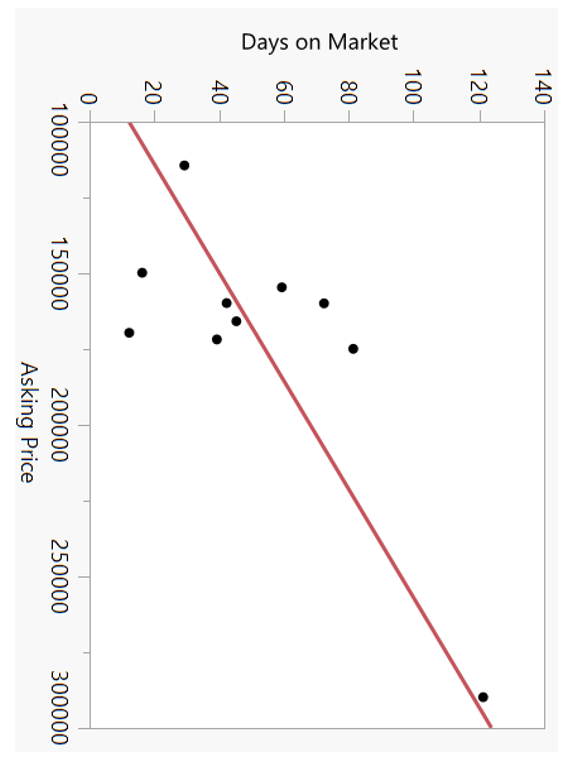
| A | $114,500 | 29 |
| B | $149,900 | 16 |
| C | $154,700 | 59 |
| D | $159,900 | 42 |
| E | $160,000 | 72 |
| F | $165,900 | 45 |
| G | $169,700 | 12 |
| H | $171,900 | 39 |
| I | $175,000 | 81 |
| J | $289,900 | 121 |
1. Using a scatterplot, describe the relationship between asking price and days on market.
2. Fit a regression model to examine the relationship between the number of days on the market is positively linearly related to the asking price.
[Insert the EXCEL output HERE]
3. Write an estimated linear regression equation.
4. What is a correlation coefficient?
5. Test whether the number of days on the market is linearly related to the asking price. Use =0.05.
6. Examine the assumptions of the regression model. List the assumptions and test whether the assumption is satisfied or not satisfied. Explain why.
7. Interpret the slope.
Step by Step Solution
There are 3 Steps involved in it
Step: 1

Get Instant Access to Expert-Tailored Solutions
See step-by-step solutions with expert insights and AI powered tools for academic success
Step: 2

Step: 3
Ace Your Homework with AI
Get the answers you need in no time with our AI-driven, step-by-step assistance
Get Started