

A Region East East Fart East Fart East Fam East Fam East Com East H East...
Fantastic news! We've Found the answer you've been seeking!
Question:
Transcribed Image Text:
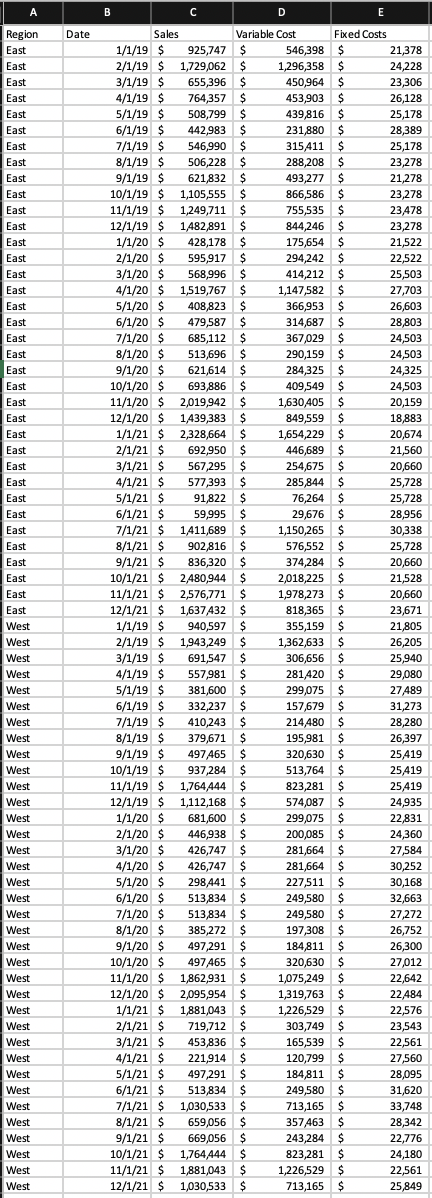
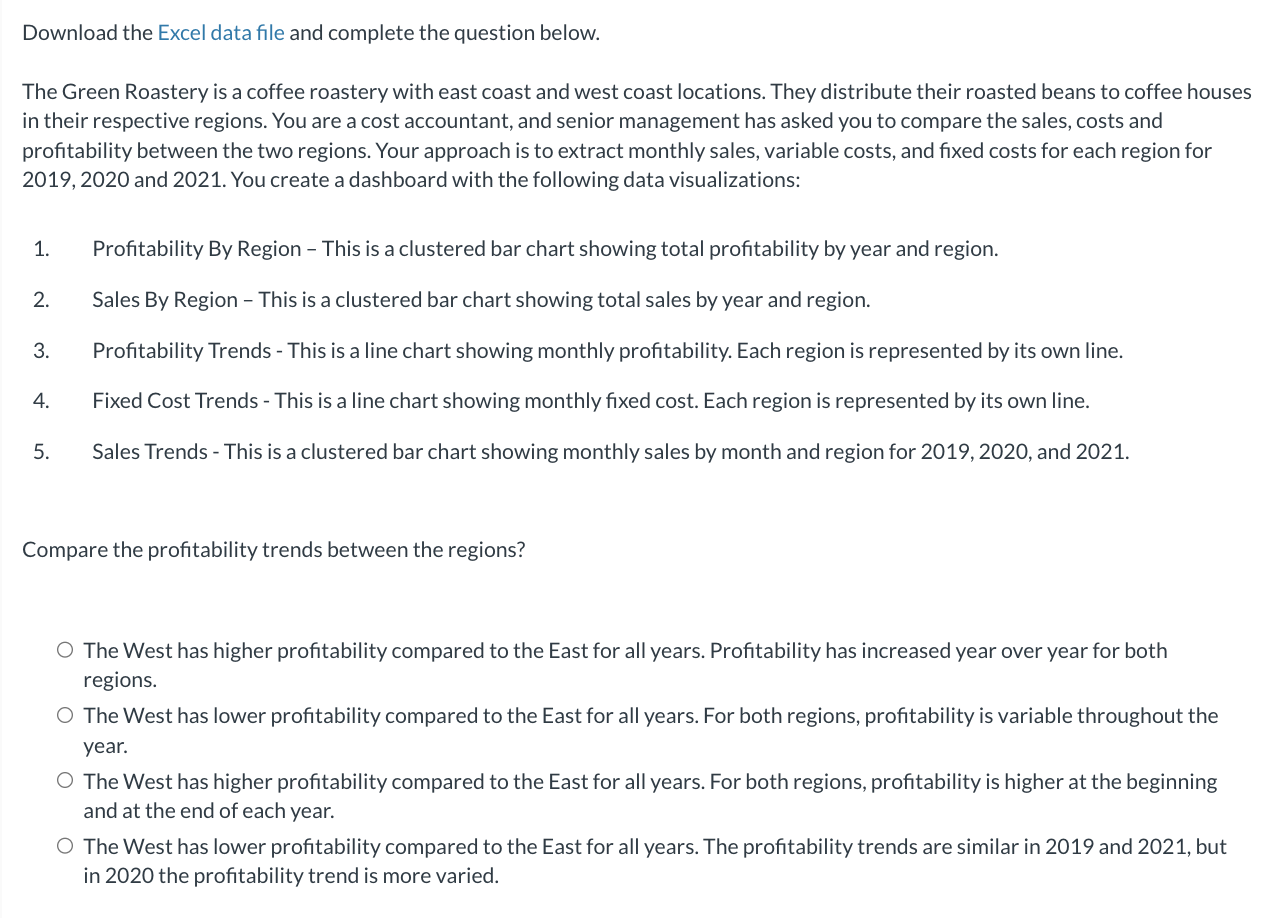
A Region East East Fart East Fart East Fam East Fam East Com East H East E East Fam East Fam East Fam East Fam East Fam East Fam East Fam East Com East Fam East Com East Fam East C East C East Fam East Fam East Com East Fart East Fart East pavas East Leaves East Loves East peces East paes East peces East Leaves East Leaves East wwws East wwws West Brea West perces West peces West perces West perces West perces West perces West perces West perces West perces West perces West perces West peces West perces West West West West www West www. West www. West www. West www. West www. West www. West www. West www. West www. West www. West www. West www. West www West www West wwwk West West West West Date B Sales 1/1/19 $ 2/1/19 $ 3/1/19 $ $ Anno 4/1/19 chho 5/1/19 $ chho 6/1/19 $ 7/1/19 $ P 8/1/19 $ 9/1/19 $ $ 104.40 10/1/19 114/06 11/1/19 12/40 12/1/19 $ $ 1/1/20 $ Suba 2/1/20 $ Suba 3/1/20 $ Alho A 4/1/20 $ ba 5/1/20 $ chho 6/1/20 $ 7/1/20 $ albo 8/1/20 $ of bo 9/1/20 $ 104.00 10/1/20 $ 11/1/20 $ 134.00 12/1/20 $ ahh 1/1/21 $ 2/1/21 $ 3/1/21 $ Y 4/1/21 $ chi 5/1/21 $ cha 6/1/21 $ akba 7/1/21 $ Haw 8/1/21 $ ob 9/1/21 $ sokba 10/1/21 $ www 11/1/21 $ *** 12/1/21 $ 1/1/19 $ 2/1/19 $ DIY 3/1/19 $ 4/1/19 $ 5/1/19 $ 6/1/19 $ ahho 7/1/19 $ were 8/1/19 $ 9/1/19 $ 10/1/19 $ 11/1/19 $ 12/1/19 $ 1/1/20 $ 2/1/20 $ 3/1/20 $ 4/1/20 $ 5/1/20 $ 6/1/20 $ 3/4 7/1/20 $ 24.00 8/1/20 $ 04.50 9/1/20 $ 104.00 10/1/20 $ 11/be 11/1/20 $ ----- 12/1/20 $ 1/1/21 $ 2/1/21 $ 3/1/21 $ 4/1/21 $ wa 5/1/21 $ MA 6/1/21 $ C D Variable Cost 925,747 $ 1,729,062 $ 655,396 $ A 764,357 $ A 500 799 508,799 $ 443.003 A 442,983 $ FAC.000 A 546,990 $ 505229 A 506,228 $ www.c A 621,832 $ ****.*** A 1,105,555 $ 4240 241 1,249,711 Feder 1,482,891 $ A 420470 428,178 A $ A $ 595,917 $ 550.000 A 568,996 $ ... A 1,519,767 $ A 408,823 $ 470607 A 479,587 $ A Cor 113 685,112 $ A F43.CO 513,696 $ A 621,614 $ 602 996 A 693,886 $ 2016052 A 2,019,942 $ 420 303 A 1,439,383 $ 220 CCA 2,328,664 $ 502.050 692,950 $ 567,295 $ ****** 577,393 $ Berper 91,822 $ www X 59,995 $ wwwww 1411,689 $ + 902,816 $ ****** 836,320 $ ******* 2,480,944 $ www. 2,576,771 $ **** 1,637432 $ Spearhee 940,597 $ 1063340 1,943,249 $ ****** 691,547 $ + ****** 557,981 $ perpet 381,600 $ ****** 410,243 333333 332,237 $ Y $ + ***.*** 379,671 $ Beware + 497 465 $ ***** 937,284 $ www. 1,764,444 $ ******* 1,112,168 $ ******* 681,600 $ 446,938 $ www 426,747 $ 426,747 $ 298,441 $ 513.924 A 513,834 $ F13024 A 513,834 $ ***.*** A 385,272 $ A $ 407.201 497,291 www 497465 $ A 1963,021 * 1,862,931 $ * 2,095,954 $ 1.001.045 1,881,043 $ HOM 719,712 $ A 453026 453,836 $ **** 221,914 *** 497,291 $ + F43024 A 513,834 $ A $ 1030533 ^ 7/1/21 $ 1,030,533 $ 8/1/21 $ 9/1/21 $ 10/1/21 $ 11/1/21 $ 12/1/21 $ GEODES 659,056 $ 669,056 $ 1,764,444 $ 1,881,043 $ 1,030,533 $ E Fixed Costs 546,398 $ 1,296,358 $ 450,964 $ A 453,903 $ 420916 439,816 $ 221.990 d 231,880 $ 242444 315411 $ A 300 300 A 288,208 $ * 403377 493,277 $ A DCC FOC 866,586 $ SEE FAR 755,535 $ A 244 245 844,246 $ 175 65 A A 175,654 $ 304363 294,242 $ www. 414,212 $ A 1,147,582 $ ACCES A 366,953 $ A ****** 314,687 $ A 362.030 367,029 $ d 290 159 290,159 $ 284,325 $ A 400 540 409,549 $ ****** 1,630,405 $ 040 FFO 849,559 $ A A 1654 220 1,654,229 $ A45 690 446,689 $ 254,675 $ w 285,844 $ ****** 76,264 $ ***** + 29,676 ****** + $ $ * 1,150,265 **** 576,552 ****** + 374,284 www.*** + $ $ 2,018,225 *** 1,978,273 ****** 281,420 ***.*** 299,075 $ + $ + $ + 818,365 ****** $ 355,159 1363633 + 1,362,633 ****** + 306,656 $ $ + $ + $ + $ $ + ****.*** 157,679 ****** + 214,480 $ ***.*** + 195,981 ***.*** 320,630 $ ****** + 513,764 ***.*** + 823,281 www.w + 574,087 $ $ $ ***** 299,075 $ were 200,085 $ 281,664 $ 281,664 $ 227,511 $ 240 590 + 249,580 $ 340500 + A 249,580 $ ****** 197,308 $ 200 184,811 $ 230.620 A A 320,630 $ A 5035 240 1,075,249 $ A 1210 1,319,763 + 1.336.630 1,226,529 ****** 303,749 $ ACE FRO 165,539 $ 120.700 120,799 $ ****** 184,811 $ * * A ***.*** A 249,580 $ $ A $ MANAGE 713,165 $ * 257 462 357,463 $ 243,284 $ 823,281 $ 1,226,529 $ 713,165 $ 21,378 24,228 23,306 26 129 26,128 25 170 25,178 30.300 28,389 25 170 25,178 22.30 23,278 MAZO 21,278 23.370 23,278 ***** 23,478 **.*** 23,278 ww 21,522 33633 22,522 35 503 25,503 ***** 27,703 26.603 26,603 30.003 28,803 34503 24,503 DACOS 24,503 24335 24,325 24.502 24,503 20150 20,159 10.003 18,883 20.634 20,674 21.550 21,560 20,660 wwwww 25,728 ***** 25,728 ***** 28,956 ***** 30,338 ***** 25,728 ***** 20,660 ***** 21,528 ***** 20,660 **.*** 23,671 **** 21,805 ***** 26,205 ***** 25,940 ***** 29,080 ***** 27489 *** 31,273 ***** 28,280 ***** 26,397 wwwww 25,419 ***** 25,419 ***** 25,419 MON 24,935 ***** 22,831 ***** 24,360 ***** 27,584 30,252 30,168 22.445 32,663 ***** 27,272 ww 26,752 ***** 26,300 ***** 27,012 23663 22,642 23.404 22,484 ***** 22,576 ***** 23,543 22,561 27,560 20.005 28,095 21.620 31,620 22 DI 33,748 200 28,342 22 776 22,776 24,180 22,561 25,849 Download the Excel data file and complete the question below. The Green Roastery is a coffee roastery with east coast and west coast locations. They distribute their roasted beans to coffee houses in their respective regions. You are a cost accountant, and senior management has asked you to compare the sales, costs and profitability between the two regions. Your approach is to extract monthly sales, variable costs, and fixed costs for each region for 2019, 2020 and 2021. You create a dashboard with the following data visualizations: 1. 2. 3. 4. 5. Profitability By Region - This is a clustered bar chart showing total profitability by year and region. Sales By Region - This is a clustered bar chart showing total sales by year and region. Profitability Trends - This is a line chart showing monthly profitability. Each region is represented by its own line. Fixed Cost Trends - This is a line chart showing monthly fixed cost. Each region is represented by its own line. Sales Trends - This is a clustered bar chart showing monthly sales by month and region for 2019, 2020, and 2021. Compare the profitability trends between the regions? O The West has higher profitability compared to the East for all years. Profitability has increased year over year for both regions. O The West has lower profitability compared to the East for all years. For both regions, profitability is variable throughout the year. O The West has higher profitability compared to the East for all years. For both regions, profitability is higher at the beginning and at the end of each year. O The West has lower profitability compared to the East for all years. The profitability trends are similar in 2019 and 2021, but in 2020 the profitability trend is more varied. A Region East East Fart East Fart East Fam East Fam East Com East H East E East Fam East Fam East Fam East Fam East Fam East Fam East Fam East Com East Fam East Com East Fam East C East C East Fam East Fam East Com East Fart East Fart East pavas East Leaves East Loves East peces East paes East peces East Leaves East Leaves East wwws East wwws West Brea West perces West peces West perces West perces West perces West perces West perces West perces West perces West perces West perces West peces West perces West West West West www West www. West www. West www. West www. West www. West www. West www. West www. West www. West www. West www. West www. West www West www West wwwk West West West West Date B Sales 1/1/19 $ 2/1/19 $ 3/1/19 $ $ Anno 4/1/19 chho 5/1/19 $ chho 6/1/19 $ 7/1/19 $ P 8/1/19 $ 9/1/19 $ $ 104.40 10/1/19 114/06 11/1/19 12/40 12/1/19 $ $ 1/1/20 $ Suba 2/1/20 $ Suba 3/1/20 $ Alho A 4/1/20 $ ba 5/1/20 $ chho 6/1/20 $ 7/1/20 $ albo 8/1/20 $ of bo 9/1/20 $ 104.00 10/1/20 $ 11/1/20 $ 134.00 12/1/20 $ ahh 1/1/21 $ 2/1/21 $ 3/1/21 $ Y 4/1/21 $ chi 5/1/21 $ cha 6/1/21 $ akba 7/1/21 $ Haw 8/1/21 $ ob 9/1/21 $ sokba 10/1/21 $ www 11/1/21 $ *** 12/1/21 $ 1/1/19 $ 2/1/19 $ DIY 3/1/19 $ 4/1/19 $ 5/1/19 $ 6/1/19 $ ahho 7/1/19 $ were 8/1/19 $ 9/1/19 $ 10/1/19 $ 11/1/19 $ 12/1/19 $ 1/1/20 $ 2/1/20 $ 3/1/20 $ 4/1/20 $ 5/1/20 $ 6/1/20 $ 3/4 7/1/20 $ 24.00 8/1/20 $ 04.50 9/1/20 $ 104.00 10/1/20 $ 11/be 11/1/20 $ ----- 12/1/20 $ 1/1/21 $ 2/1/21 $ 3/1/21 $ 4/1/21 $ wa 5/1/21 $ MA 6/1/21 $ C D Variable Cost 925,747 $ 1,729,062 $ 655,396 $ A 764,357 $ A 500 799 508,799 $ 443.003 A 442,983 $ FAC.000 A 546,990 $ 505229 A 506,228 $ www.c A 621,832 $ ****.*** A 1,105,555 $ 4240 241 1,249,711 Feder 1,482,891 $ A 420470 428,178 A $ A $ 595,917 $ 550.000 A 568,996 $ ... A 1,519,767 $ A 408,823 $ 470607 A 479,587 $ A Cor 113 685,112 $ A F43.CO 513,696 $ A 621,614 $ 602 996 A 693,886 $ 2016052 A 2,019,942 $ 420 303 A 1,439,383 $ 220 CCA 2,328,664 $ 502.050 692,950 $ 567,295 $ ****** 577,393 $ Berper 91,822 $ www X 59,995 $ wwwww 1411,689 $ + 902,816 $ ****** 836,320 $ ******* 2,480,944 $ www. 2,576,771 $ **** 1,637432 $ Spearhee 940,597 $ 1063340 1,943,249 $ ****** 691,547 $ + ****** 557,981 $ perpet 381,600 $ ****** 410,243 333333 332,237 $ Y $ + ***.*** 379,671 $ Beware + 497 465 $ ***** 937,284 $ www. 1,764,444 $ ******* 1,112,168 $ ******* 681,600 $ 446,938 $ www 426,747 $ 426,747 $ 298,441 $ 513.924 A 513,834 $ F13024 A 513,834 $ ***.*** A 385,272 $ A $ 407.201 497,291 www 497465 $ A 1963,021 * 1,862,931 $ * 2,095,954 $ 1.001.045 1,881,043 $ HOM 719,712 $ A 453026 453,836 $ **** 221,914 *** 497,291 $ + F43024 A 513,834 $ A $ 1030533 ^ 7/1/21 $ 1,030,533 $ 8/1/21 $ 9/1/21 $ 10/1/21 $ 11/1/21 $ 12/1/21 $ GEODES 659,056 $ 669,056 $ 1,764,444 $ 1,881,043 $ 1,030,533 $ E Fixed Costs 546,398 $ 1,296,358 $ 450,964 $ A 453,903 $ 420916 439,816 $ 221.990 d 231,880 $ 242444 315411 $ A 300 300 A 288,208 $ * 403377 493,277 $ A DCC FOC 866,586 $ SEE FAR 755,535 $ A 244 245 844,246 $ 175 65 A A 175,654 $ 304363 294,242 $ www. 414,212 $ A 1,147,582 $ ACCES A 366,953 $ A ****** 314,687 $ A 362.030 367,029 $ d 290 159 290,159 $ 284,325 $ A 400 540 409,549 $ ****** 1,630,405 $ 040 FFO 849,559 $ A A 1654 220 1,654,229 $ A45 690 446,689 $ 254,675 $ w 285,844 $ ****** 76,264 $ ***** + 29,676 ****** + $ $ * 1,150,265 **** 576,552 ****** + 374,284 www.*** + $ $ 2,018,225 *** 1,978,273 ****** 281,420 ***.*** 299,075 $ + $ + $ + 818,365 ****** $ 355,159 1363633 + 1,362,633 ****** + 306,656 $ $ + $ + $ + $ $ + ****.*** 157,679 ****** + 214,480 $ ***.*** + 195,981 ***.*** 320,630 $ ****** + 513,764 ***.*** + 823,281 www.w + 574,087 $ $ $ ***** 299,075 $ were 200,085 $ 281,664 $ 281,664 $ 227,511 $ 240 590 + 249,580 $ 340500 + A 249,580 $ ****** 197,308 $ 200 184,811 $ 230.620 A A 320,630 $ A 5035 240 1,075,249 $ A 1210 1,319,763 + 1.336.630 1,226,529 ****** 303,749 $ ACE FRO 165,539 $ 120.700 120,799 $ ****** 184,811 $ * * A ***.*** A 249,580 $ $ A $ MANAGE 713,165 $ * 257 462 357,463 $ 243,284 $ 823,281 $ 1,226,529 $ 713,165 $ 21,378 24,228 23,306 26 129 26,128 25 170 25,178 30.300 28,389 25 170 25,178 22.30 23,278 MAZO 21,278 23.370 23,278 ***** 23,478 **.*** 23,278 ww 21,522 33633 22,522 35 503 25,503 ***** 27,703 26.603 26,603 30.003 28,803 34503 24,503 DACOS 24,503 24335 24,325 24.502 24,503 20150 20,159 10.003 18,883 20.634 20,674 21.550 21,560 20,660 wwwww 25,728 ***** 25,728 ***** 28,956 ***** 30,338 ***** 25,728 ***** 20,660 ***** 21,528 ***** 20,660 **.*** 23,671 **** 21,805 ***** 26,205 ***** 25,940 ***** 29,080 ***** 27489 *** 31,273 ***** 28,280 ***** 26,397 wwwww 25,419 ***** 25,419 ***** 25,419 MON 24,935 ***** 22,831 ***** 24,360 ***** 27,584 30,252 30,168 22.445 32,663 ***** 27,272 ww 26,752 ***** 26,300 ***** 27,012 23663 22,642 23.404 22,484 ***** 22,576 ***** 23,543 22,561 27,560 20.005 28,095 21.620 31,620 22 DI 33,748 200 28,342 22 776 22,776 24,180 22,561 25,849 Download the Excel data file and complete the question below. The Green Roastery is a coffee roastery with east coast and west coast locations. They distribute their roasted beans to coffee houses in their respective regions. You are a cost accountant, and senior management has asked you to compare the sales, costs and profitability between the two regions. Your approach is to extract monthly sales, variable costs, and fixed costs for each region for 2019, 2020 and 2021. You create a dashboard with the following data visualizations: 1. 2. 3. 4. 5. Profitability By Region - This is a clustered bar chart showing total profitability by year and region. Sales By Region - This is a clustered bar chart showing total sales by year and region. Profitability Trends - This is a line chart showing monthly profitability. Each region is represented by its own line. Fixed Cost Trends - This is a line chart showing monthly fixed cost. Each region is represented by its own line. Sales Trends - This is a clustered bar chart showing monthly sales by month and region for 2019, 2020, and 2021. Compare the profitability trends between the regions? O The West has higher profitability compared to the East for all years. Profitability has increased year over year for both regions. O The West has lower profitability compared to the East for all years. For both regions, profitability is variable throughout the year. O The West has higher profitability compared to the East for all years. For both regions, profitability is higher at the beginning and at the end of each year. O The West has lower profitability compared to the East for all years. The profitability trends are similar in 2019 and 2021, but in 2020 the profitability trend is more varied.
Expert Answer:

Related Book For 

Holt McDougal Larson Geometry
ISBN: 9780547315171
1st Edition
Authors: Ron Larson, Laurie Boswell, Timothy D. Kanold, Lee Stiff
Posted Date:
Students also viewed these accounting questions
-
Arene C has the composition 90.6% carbon and 9.4% hydrogen. Its mass and 1H NMR spectra are shown below. a. b. a. Calculate the empirical formula of C. b. From the mass spectrum, find the molecular...
-
Question 2 Find the arc length of the curve r = -3 cos (0) - 3 over the interval 0 0 Enter an exact answer. 3 Provide your answer below: L =
-
The following additional information is available for the Dr. Ivan and Irene Incisor family from Chapters 1-7. Ivan sold the following securities during the year and received a Form 1099-B that...
-
Katz Hat Shop received a shipment of hats for which it paid the wholesaler $2,970. The price of the hats was $3,000, but Katz was given a $30 cash discount and required to pay freight charges of $50....
-
In bacteria much of the putrescine is synthesized, not from ornithine but from arginine, which decarboxylates to yield agmatine. Formulate a plausible pathway from arginine to putrescine, using this...
-
Conduct research to determine the impact of the Sarbanes-Oxley Act (SOX), Generally Accepted Accounting Principles ( GAAP ), Generally Accepted Auditing Standards (GAAS), and the International...
-
Below is a list of financial statement items. Required 1. Indicate whether each item is found on the income statement (IS), statement of retained earnings (RE), and/or balance sheet (BS). 2. User...
-
Using the information in BE5-14, determine Martinezs free cash flow, assuming that it reported net cash provided by operating activities of $400,000.
-
In a video game airplanes move from left to right along the path described by y 2 + They can shoot rockets tangent to the direction of ight at targets on the x- axis located at x = 1, 2, 3, and 4. 0...
-
Toyota Motor Corporation (TM) uses target costing. Assume that Toyota marketing personnel estimate that the competitive, average selling price for the Rav4 in the upcoming model year will need to be...
-
A cyclist rides her bike at a speed of 2 meters per second. What is this speed in kilometers per hour? How many kilometers will the cyclist travel in 4 hours? Do not round your answers.Speed:Distance...
-
What more radical solutions do you think should be considered?
-
Continuous improvement is not really useful as it just tinkers with existing operations and does not look for significant gains. To what extent do you think this is true?
-
The primary difference between financial accounting and managerial accounting is that a. Financial accounting is used by internal parties while managerial accounting is used by external parties. b....
-
Performance measures can give conflicting views changes that improve some measures, make others worse. How can you decide whether the overall effect is beneficial or not?
-
It is easy to find improvements in any supply chain. So why have the managers not already made them?
-
Gracius Manufacturing is approached by a European customer to fulfill a one-time-only special order for a product similar to one offered to domestic customers. Gracius Manufacturing has a policy of...
-
1) The government decided to reduce taxes on fast-food to increase revenue. The government assumes that fast-food products have a) An inelastic demand b) An elastic demand c) A demand curve that is...
-
Write the theorem that justifies the statement. jik 1. 2 k
-
Assume that the wheelchair ramps described each have a slope of 1/12, which is the maximum slope recommended for a wheelchair ramp. A wheelchair ramp has a 21 foot run. What is its rise? ww
-
In Exercises 21-25, use the property to copy and complete the statement. Addition Property of Equality: If AB = CD, then_? + EF = _?__ + EF.
-
Special order decision given revised data (Learning Objective 2) Consider the ACDelco special sales order example on pages 419-421. Suppose ACDelcos variable manufacturing cost is $1.35 per oil...
-
Determine relevance of information (Learning Objective 1) You are trying to decide whether to trade in your ink-jet printer for a more recent model. Your usage pattern will remain unchanged, but the...
-
Drop a department: revised information (Learning Objective 4) Consider Knight Fashion from S8-5. Assume that the fixed expenses assigned to each department include only direct fixed costs of the...

Study smarter with the SolutionInn App