Answered step by step
Verified Expert Solution
Link Copied!

Question

1 Approved Answer

A researcher conducts a mileage economy test involving 88 cars. The frequency distribution describing average miles per gallon (mpg) appears in the following table. a-1.
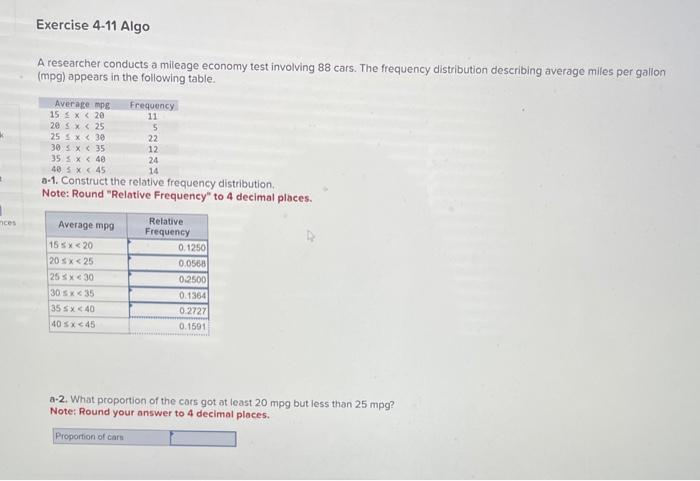
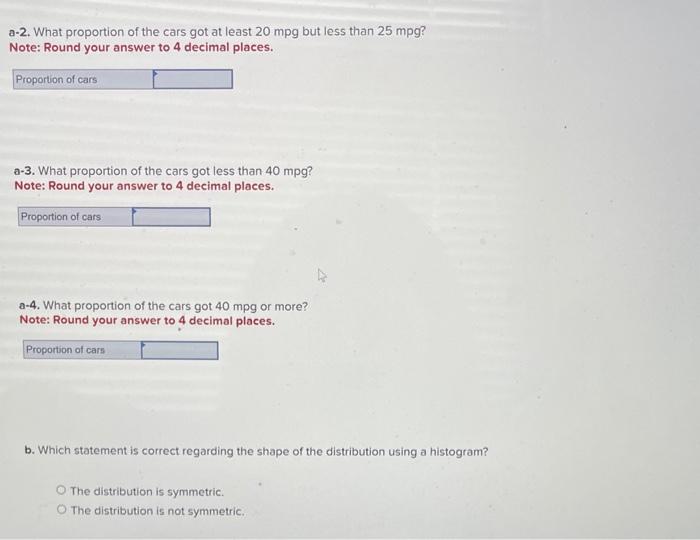
image text in transcribed
A researcher conducts a mileage economy test involving 88 cars. The frequency distribution describing average miles per gallon (mpg) appears in the following table. a-1. Construct the relative frequency distribution. Note: Round "Relative Frequency" to 4 decimal places. a.2. What proportion of the cars got at least 20 mpg but less than 25mpg ? Note: Round your answer to 4 decimal places. a-2. What proportion of the cars got at least 20mpg but less than 25mpg ? Note: Round your answer to 4 decimal places. a-3. What proportion of the cars got less than 40mpg ? Note: Round your answer to 4 decimal places. a-4. What proportion of the cars got 40mpg or more? Note: Round your answer to 4 decimal places. b. Which statement is correct regarding the shape of the distribution using a histogram? The distribution is symmetric. The distribution is not symmetric

Step by Step Solution

There are 3 Steps involved in it

Step: 1

blur-text-image

Get Instant Access to Expert-Tailored Solutions

See step-by-step solutions with expert insights and AI powered tools for academic success

Step: 2

blur-text-image

Step: 3

blur-text-image

Ace Your Homework with AI

Get the answers you need in no time with our AI-driven, step-by-step assistance

Get Started

Recommended Textbook for

Financial Sorcery Magical Strategies To Create Real And Lasting Wealth

Authors: Jason Miller

1st Edition

1601632185, 9781601632180

Students also viewed these Finance questions