

Question
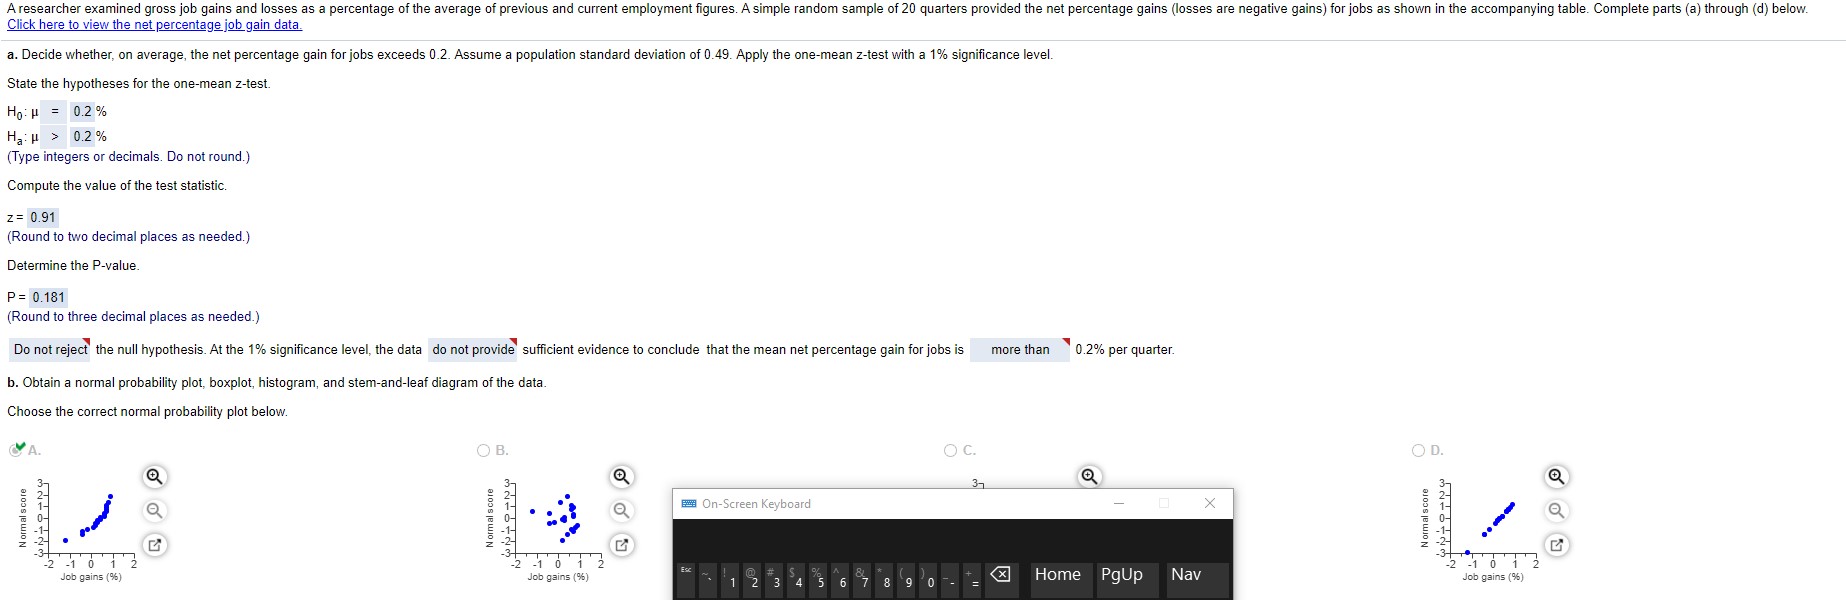
A researcher examined gross job gains and losses as a percentage of the average of previous and current employment figures. A simple random sample of
A researcher examined gross job gains and losses as a percentage of the average of previous and current employment figures. A simple random sample of 20 quarters provided the net percentage gains?(losses are negative?gains) for jobs as shown in the accompanying table. Complete parts?(a) through?(d) below.
I only help with one question
a. Decide?whether, on?average, the net percentage gain for jobs exceeds 0.2. Assume a population standard deviation of 0.49. Apply the?one-mean z-test with a 1?% significance level.
State the hypotheses for the?one-mean z-test.
H0?:?=0.2 Ha ?:?>0.2
The p value is
P (Z > 0.91) =0.1814
determine P-value is 0.181
I only need help with this question and ( I uploaded pictures to see what they ask)
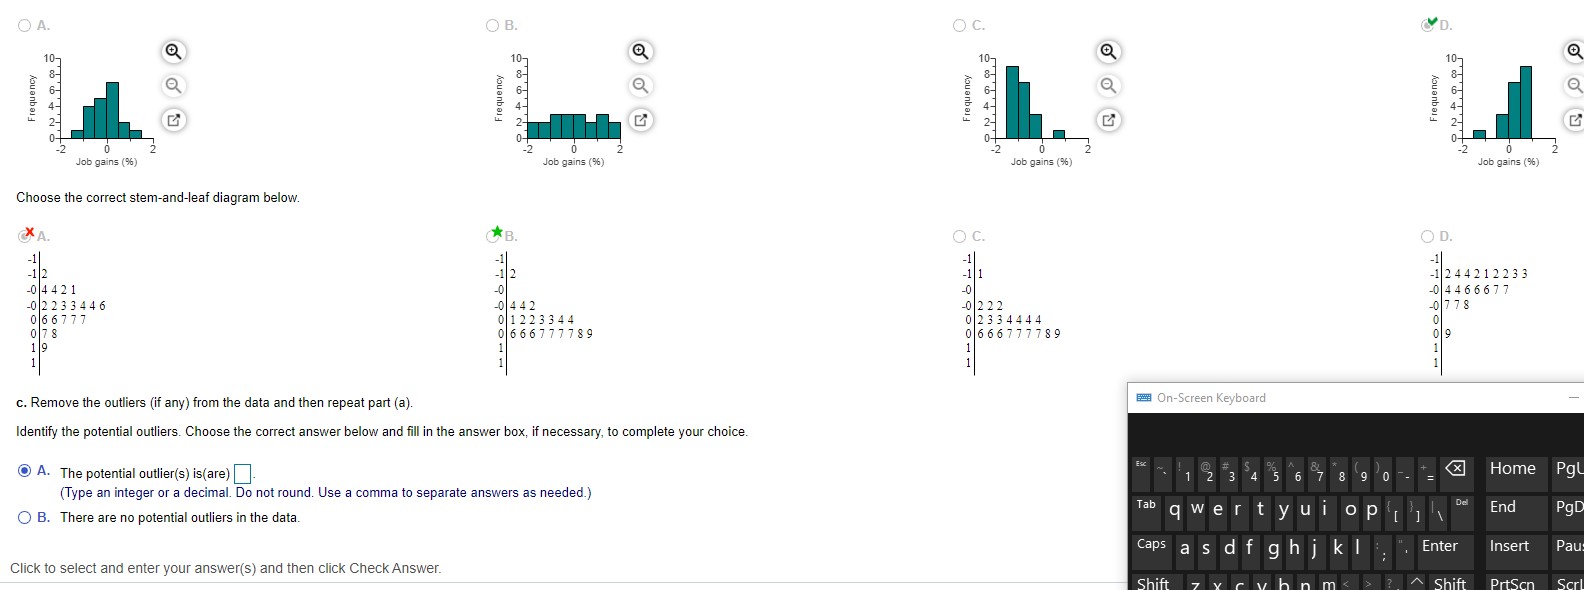
c. Remove the outliers?(if any) from the data and then repeat part?(a).
Identify the potential outliers. Choose the correct answer below and fill in the answer?box, if?necessary, to complete your choice.
A.The potential?outlier(s) is(are)
?
(Type an integer or a decimal. Do not round. Use a comma to separate answers as?needed.)
B . There are no potential outliers in the data
Step by Step Solution
There are 3 Steps involved in it
Step: 1

Get Instant Access to Expert-Tailored Solutions
See step-by-step solutions with expert insights and AI powered tools for academic success
Step: 2

Step: 3
Ace Your Homework with AI
Get the answers you need in no time with our AI-driven, step-by-step assistance
Get Started
Applied Calculus
Authors: Stefan Waner, Steven Costenoble
7th Edition
1337514306, 9781337514309