

Answered step by step
Verified Expert Solution
Question
1 Approved Answer
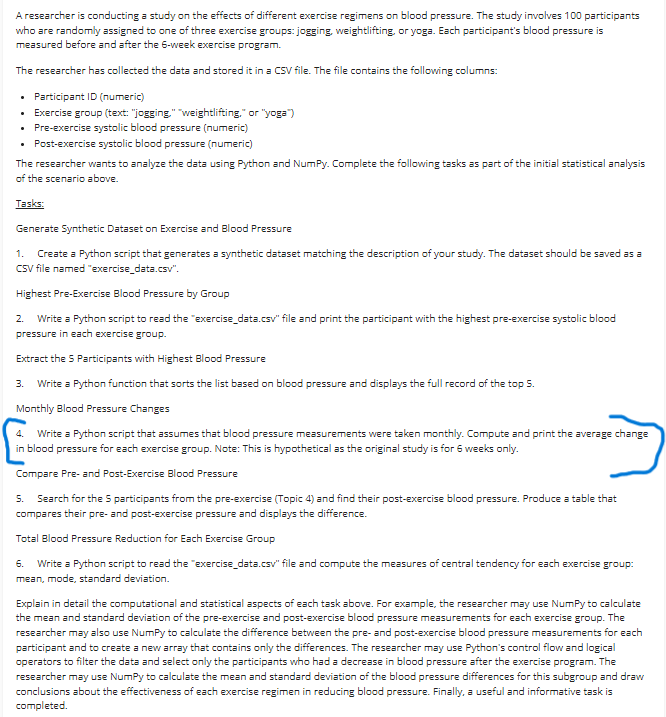
A researcher is conducting a study on the effects of different exercise regimens on blood pressure. The study involves 1 0 0 participants who are
A researcher is conducting a study on the effects of different exercise regimens on blood pressure. The study involves participants
who are randomly assigned to one of three exercise groups: jogging, weightlifting, or yoga. Each participant's blood pressure is
measured before and after the week exercise program.
The researcher has collected the data and stored it in a CSV file. The file contains the following columns:
Participant ID numeric
Exercise group text: "jogging," "weightlifting," or "yoga"
Preexercise systolic blood pressure numeric
Postexercise systolic blood pressure numeric
The researcher wants to analyze the data using Python and NumPy. Complete the following tasks as part of the initial statistical analysis
of the scenario above.
Tasks:
Generate Synthetic Dataset on Exercise and Blood Pressure
Create a Python script that generates a synthetic dataset matching the description of your study. The dataset should be saved as a
CSV file named "exercisedata.csv
Highest PreExercise Blood Pressure by Group
Write a Python script to read the "exercisedata.csv file and print the participant with the highest preexercise systolic blood
pressure in each exercise group.
Extract the Participants with Highest Blood Pressure
Write a Python function that sorts the list based on blood pressure and displays the full record of the top
Monthly Blood Pressure Changes
Write a Python script that assumes that blood pressure measurements were taken monthly. Compute and print the average change
in blood pressure for each exercise group. Note: This is hypothetical as the original study is for weeks only.
Compare Pre and PostExercise Blood Pressure
Search for the participants from the preexercise Topic and find their postexercise blood pressure. Produce a table that
compares their pre and postexercise pressure and displays the difference.
Total Blood Pressure Reduction for Each Exercise Group
Write a Python script to read the "exercisedata.csv file and compute the measures of central tendency for each exercise group:
mean, mode, standard deviation.
Explain in detail the computational and statistical aspects of each task above. For example, the researcher may use NumPy to calculate
the mean and standard deviation of the preexercise and postexercise blood pressure measurements for each exercise group. The
researcher may also use NumPy to calculate the difference between the preand postexercise blood pressure measurements for each
participant and to create a new array that contains only the differences. The researcher may use Python's control flow and logical
operators to filter the data and select only the participants who had a decrease in blood pressure after the exercise program. The
researcher may use NumPy to calculate the mean and standard deviation of the blood pressure differences for this subgroup and draw
conclusions about the effectiveness of each exercise regimen in reducing blood pressure. Finally, a useful and informative task is
completed.
Need assistance with part "Monthly Blood Pressure Changes"
Step by Step Solution
There are 3 Steps involved in it
Step: 1

Get Instant Access to Expert-Tailored Solutions
See step-by-step solutions with expert insights and AI powered tools for academic success
Step: 2

Step: 3
Ace Your Homework with AI
Get the answers you need in no time with our AI-driven, step-by-step assistance
Get Started
Databases Theory And Applications 27th Australasian Database Conference Adc 20 Sydney Nsw September 28 29 20 Proceedings Lncs 9877
Authors: Muhammad Aamir Cheema ,Wenjie Zhang ,Lijun Chang
1st Edition
3319469215, 978-3319469218