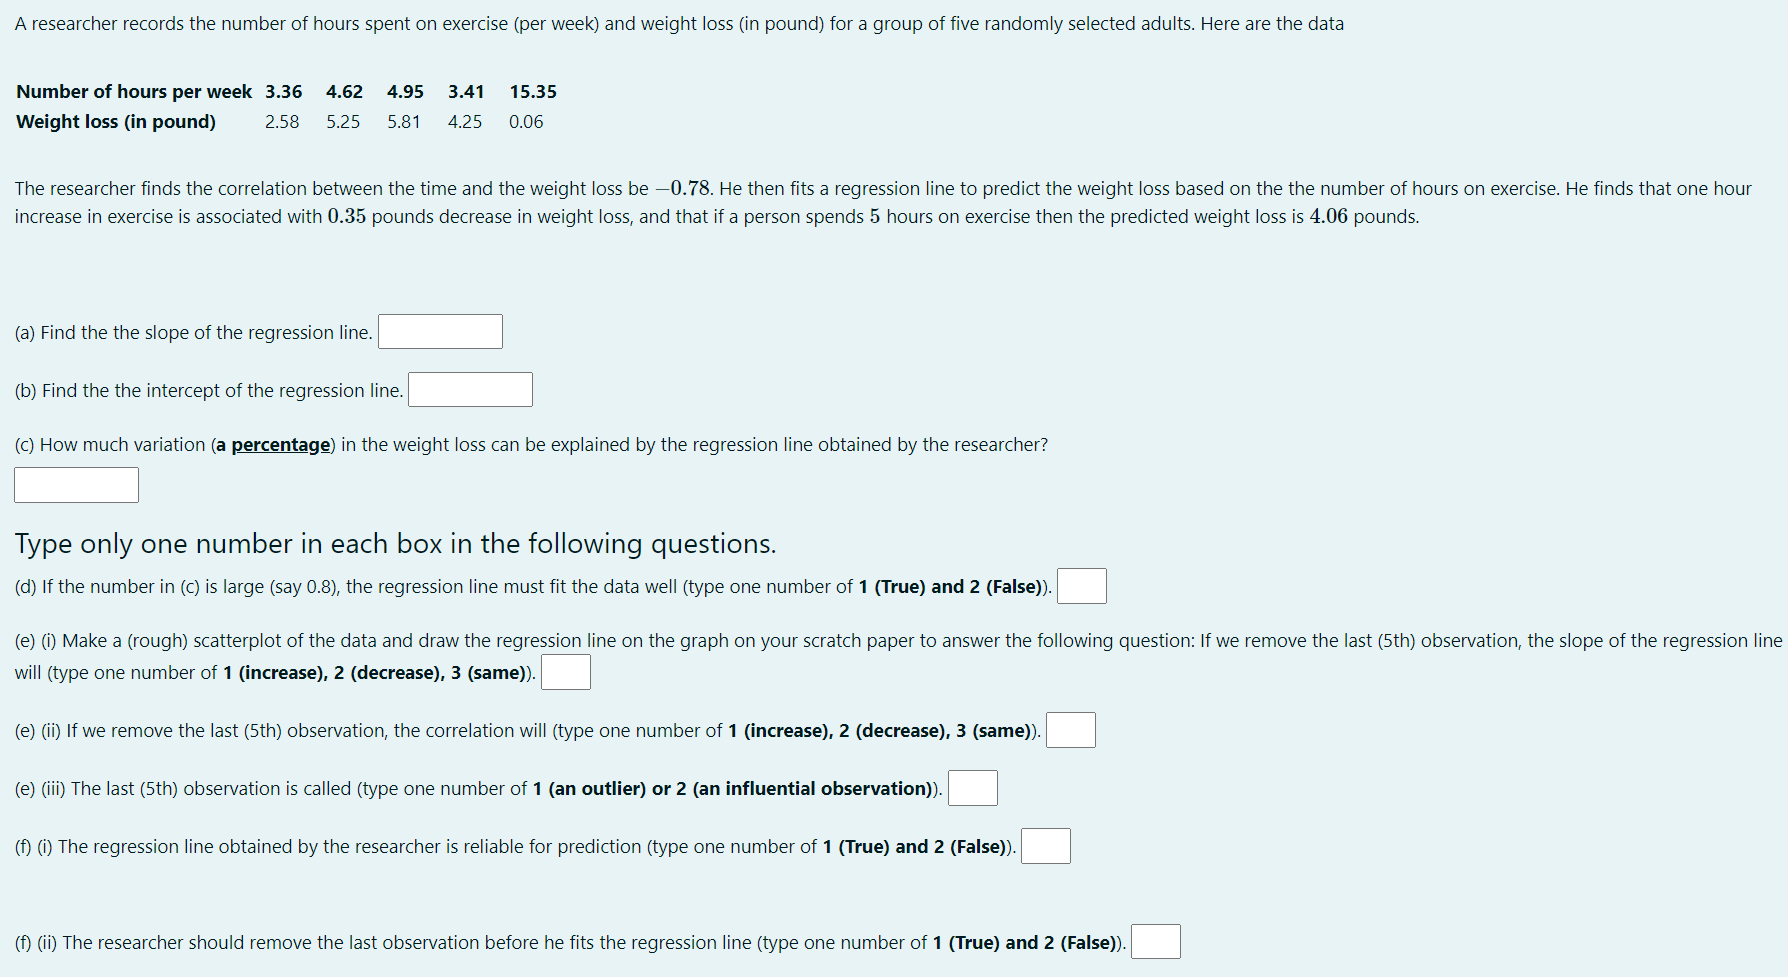
A researcher records the number of hours spent on exercise (per week) and weight loss (in pound) for a group of ve randomly selected adults. Here are the data Numberof hoursperweek 3.56 4.62 4.55 3.41 15.35 Weightloss (in pound) 2.58 5.25 5.81 4.25 0.06 The researcher finds the correlation between the time and the weight loss be 70.78. He then fiE a regression line to predict the weight loss based on the the number of hours on exercise. He nds that one hour increase in exercise is associated with 0.35 pounds decrease in weight loss, and that if a person spends 5 hours on exercise then the predicted weight loss is 4.06 pounds. (a) Find the the slope of the regression line. D (b) Find the the intercept ofthe regression line. E (c) How much variation (3 percentage) in the weight loss can be explained by the regression line obtained by the researcher? E Type only one number in each box in the following questions. (d) It the number in (c) is large (say 0.8), the regression line must fit the data well (type one number of 1 (True) and 2 (False)). E (e) (i) Make a (rough) scatterplot of the data and draw the regression line on the graph on your scratch paper to answer the following question: If we remove the last (5th) observation, the slope of the regression line will (type one number of 1 (increase), 2 (decrease). 5 (same)). \\:| (e) (ii) If we remove the last (5th) observation, the correlation will (type one number of 1 (increase), 2 (decrease), 3 (same)). \\:| (e) (iii) The last (5th) observation is called (type one number of 1 (an outlier) or 2 (an influential observation. \\:| (t) (i) The regression line obtained by the researcher is reliable for prediction (type one number of 1 (True) and 2 (False)). E (1') (ii) The researcher should remove the last observation before he fits the regression line (type one number of 1 (True) and 2 (False)). '1