Answered step by step
Verified Expert Solution
Question
1 Approved Answer
A researcher runs an experiment to study the effect of substrate loading (%) and reaction temperature (C) on lignin recovery (%) and cellulose recovery


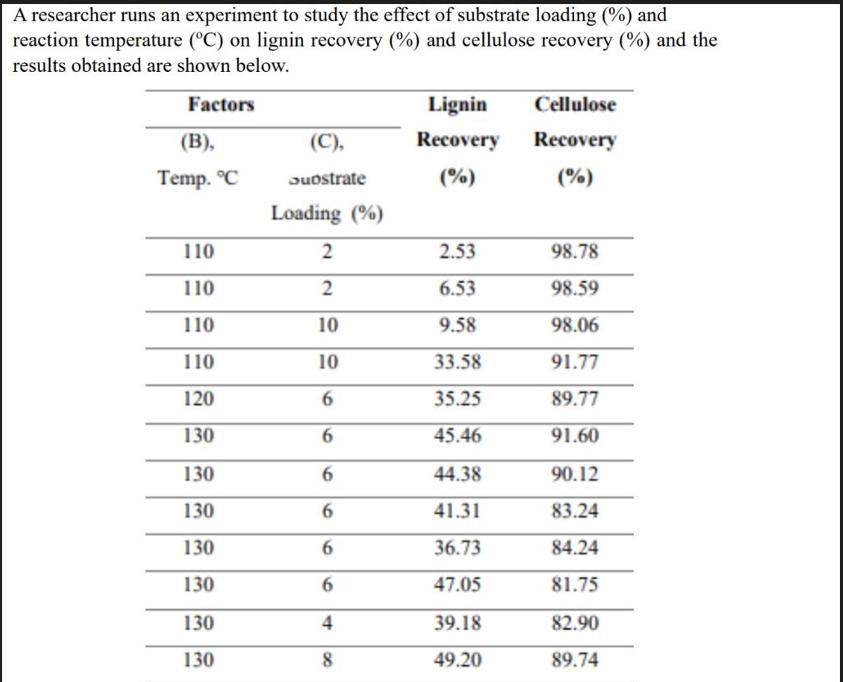
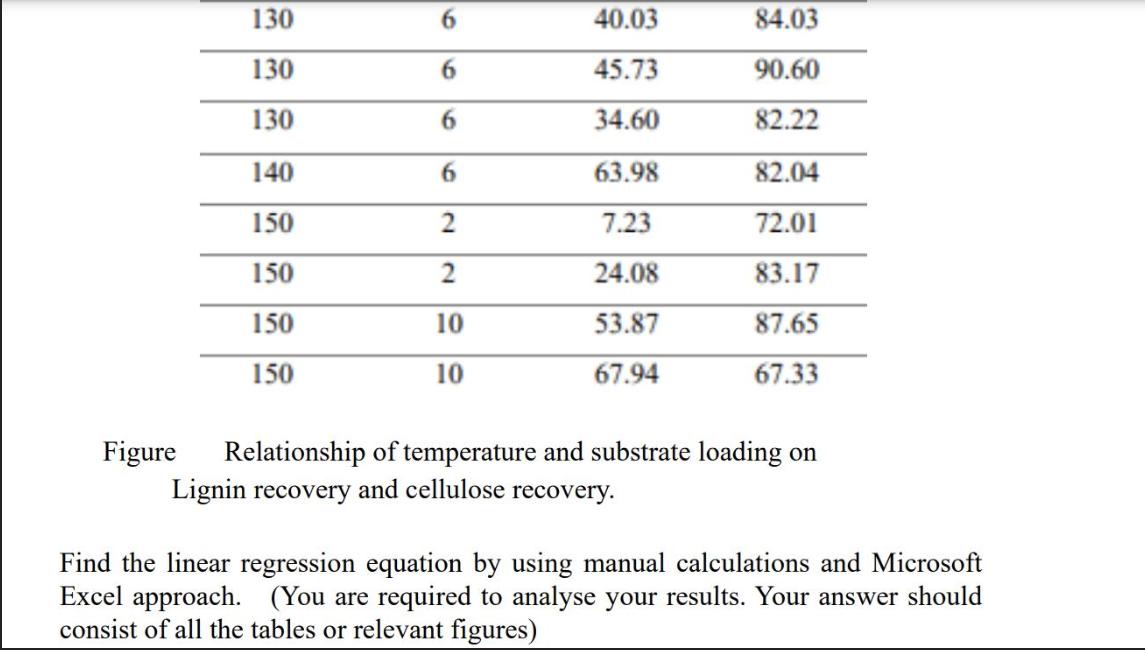
A researcher runs an experiment to study the effect of substrate loading (%) and reaction temperature (C) on lignin recovery (%) and cellulose recovery (%) and the results obtained are shown below. Factors (B), Temp. C 110 110 110 110 120 130 130 130 130 130 130 130 (C), Substrate Loading (%) 2 2 10 10 6 6 6 6 6 6 4 8 Lignin Recovery (%) 2.53 6.53 9.58 33.58 35.25 45.46 44.38 41.31 36.73 47.05 39.18 49.20 Cellulose Recovery (%) 98.78 98.59 98.06 91.77 89.77 91.60 90.12 83.24 84.24 81.75 82.90 89.74 130 130 130 140 150 150 150 150 6 6 6 2 2 10 10 40.03 45.73 34.60 63.98 7.23 24.08 53.87 67.94 84.03 90.60 82.22 82.04 72.01 83.17 87.65 67.33 Figure Relationship of temperature and substrate loading on Lignin recovery and cellulose recovery. Find the linear regression equation by using manual calculations and Microsoft Excel approach. (You are required to analyse your results. Your answer should consist of all the tables or relevant figures) A researcher runs an experiment to study the effect of substrate loading (%) and reaction temperature (C) on lignin recovery (%) and cellulose recovery (%) and the results obtained are shown below. Factors (B), Temp. C 110 110 110 110 120 130 130 130 130 130 130 130 (C), Substrate Loading (%) 2 2 10 10 6 6 6 6 6 6 4 8 Lignin Recovery (%) 2.53 6.53 9.58 33.58 35.25 45.46 44.38 41.31 36.73 47.05 39.18 49.20 Cellulose Recovery (%) 98.78 98.59 98.06 91.77 89.77 91.60 90.12 83.24 84.24 81.75 82.90 89.74 130 130 130 140 150 150 150 150 6 6 6 2 2 10 10 40.03 45.73 34.60 63.98 7.23 24.08 53.87 67.94 84.03 90.60 82.22 82.04 72.01 83.17 87.65 67.33 Figure Relationship of temperature and substrate loading on Lignin recovery and cellulose recovery. Find the linear regression equation by using manual calculations and Microsoft Excel approach. (You are required to analyse your results. Your answer should consist of all the tables or relevant figures)
Step by Step Solution
There are 3 Steps involved in it
Step: 1

Get Instant Access to Expert-Tailored Solutions
See step-by-step solutions with expert insights and AI powered tools for academic success
Step: 2

Step: 3

Ace Your Homework with AI
Get the answers you need in no time with our AI-driven, step-by-step assistance
Get Started


