

Question
A researcher suspects gender discrimination in terms of salary at a bank. To test his hypothesis, he has run the two regressions in the attached
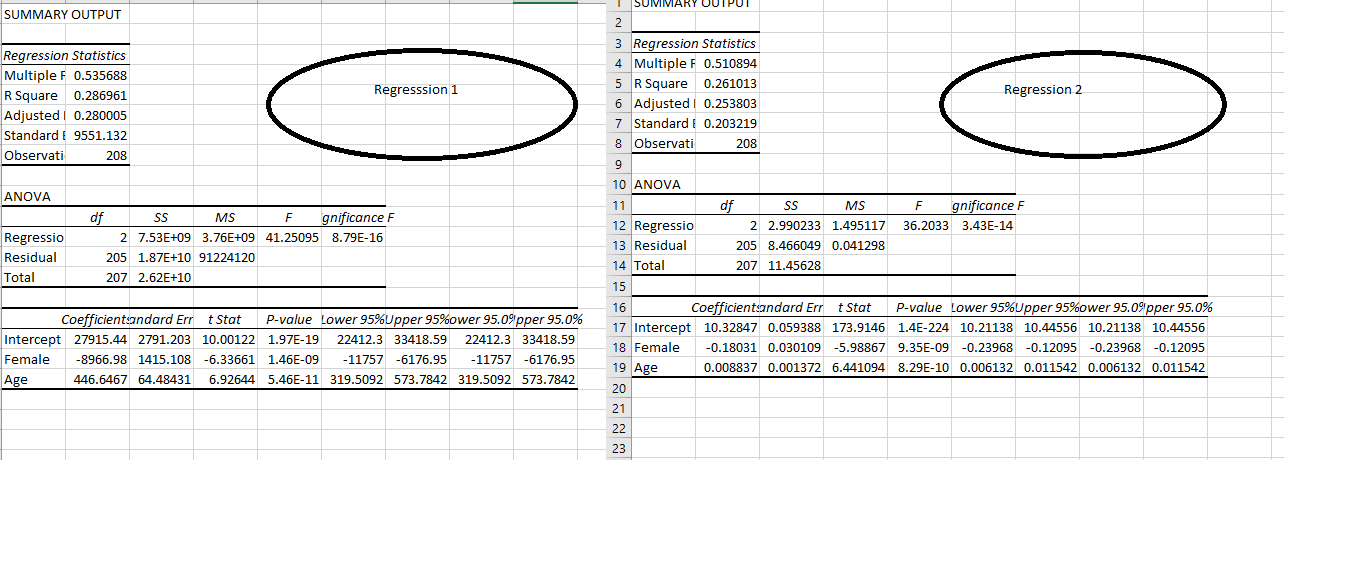
A researcher suspects gender discrimination in terms of salary at a bank. To test his hypothesis, he has run the two regressions in the attached spreadsheet. In "Regression 1", salary is the dependent variable, whereas in "Regression 2" he used the natural log of salary as the dependent variable. Which regression model should he choose?
- The researcher should choose the model in "Regression 1" because of the higher R2.
2. The researcher should choose the model in "Regression 1" because of the higher adjusted R2.
3. The researcher should choose the model in "Regression 2" because of the lower standard error.
4.We cannot use adjusted R2 or standard errors for model selection in this case, as the models have different dependent variables.
Step by Step Solution
There are 3 Steps involved in it
Step: 1

Get Instant Access to Expert-Tailored Solutions
See step-by-step solutions with expert insights and AI powered tools for academic success
Step: 2

Step: 3
Ace Your Homework with AI
Get the answers you need in no time with our AI-driven, step-by-step assistance
Get Started
Modeling the Dynamics of Life Calculus and Probability for Life Scientists
Authors: Frederick R. Adler
3rd edition
840064187, 978-1285225975, 128522597X, 978-0840064189