Question
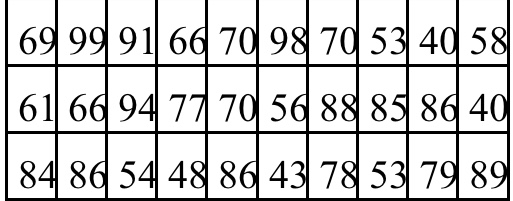
A researcher was interested in the anxiety present in students just prior to the midterm exam. The research used an anxiety self-quiz to gage the
A researcher was interested in the anxiety present in students just prior to the midterm exam. The research used an anxiety self-quiz to gage the students anxiety. The score for 30 students are given here. See graph image below
1. Construct a frequency table with class, frequency, relative percent, and cumulative percent that has 6 classes to describe the distribution of the data in SPSS.
2. Use the frequency table created in problem to construct a histogram in SPSS.
3. Use SPSS to calculate the numerical descriptive statistics mean, median, standard deviation, and variance of the anxiety scores.

|
|
Step by Step Solution
There are 3 Steps involved in it
Step: 1

Get Instant Access to Expert-Tailored Solutions
See step-by-step solutions with expert insights and AI powered tools for academic success
Step: 2

Step: 3

Ace Your Homework with AI
Get the answers you need in no time with our AI-driven, step-by-step assistance
Get Started


