
A) Russia
B) Brazil
C) Indonesia
D) South Africa
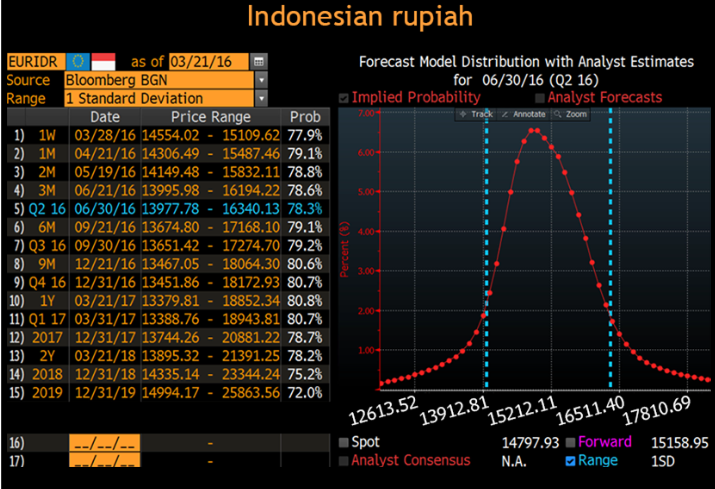
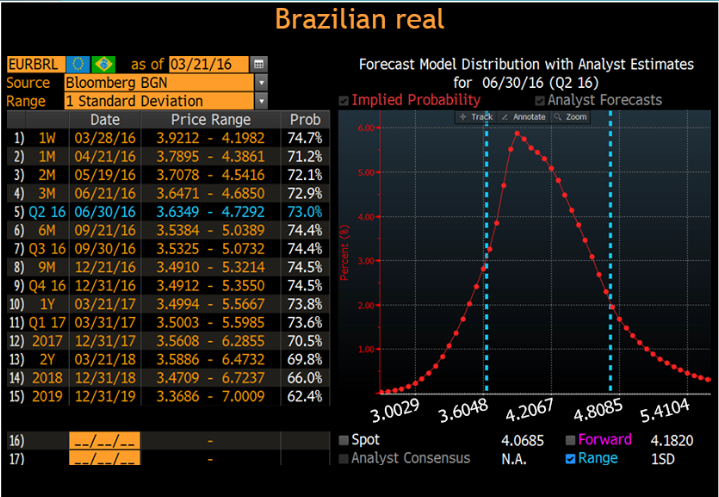
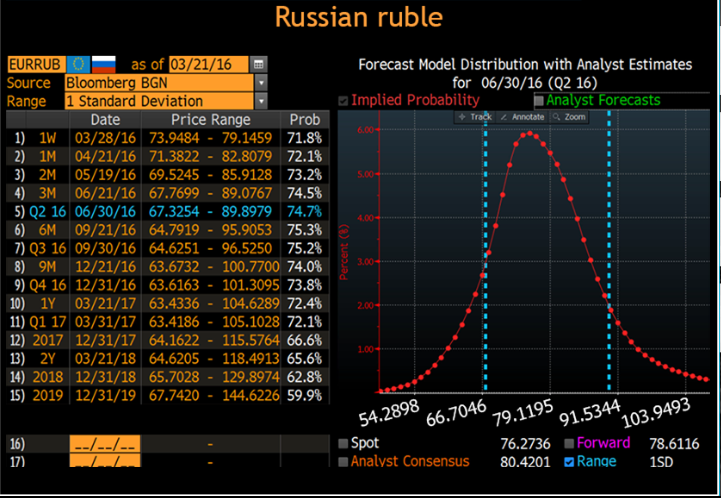
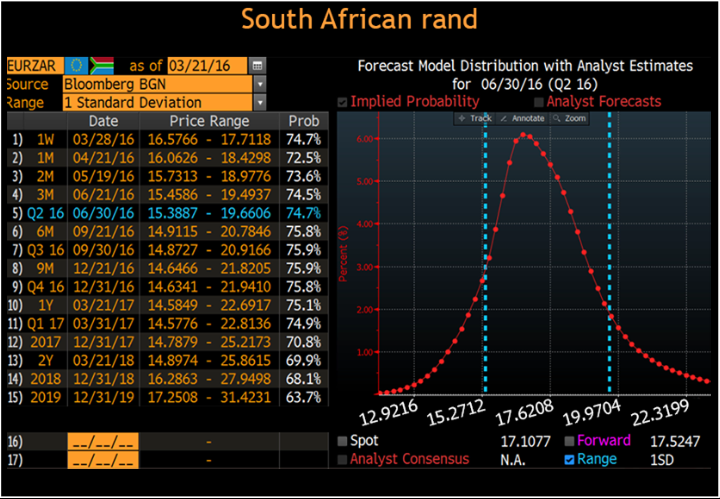
In early 2016, the same Germany machinery company has interest from four prospective clients from emerging markets: Indonesia, Brazil, Russia, and South Africa. They all want to buy ten machines, but the factory can only produce ten in time. Therefore, the company has to choose only one client. Given the volatility of the domestic currencies of the four prospective clients, the CFO would like to choose the client which is least likely to cancel the order due to currency volatility. The invoice comes due on June 30, 2016. According to volatility alone, which prospective client would be most likely to cancel the order? Indonesian rupiah Forecast Model Distribution with Analyst Estimates for 06/30/16 (Q2 16) Implied Probability Analyst Forecasts 7.00 ma non sono sono in Track Track Annotate Zoom EURIDRO - as of 03/21/16 Source Bloomberg BGN Range 1 Standard Deviation Date Price Range Prob 1) 1W 03/28/16 14554.02 - 15109.62 77.98 | 2) 1M 04/21/16 14306.49 - 15487,46 79.1% 3) 2M 05/19/16 14149.48 - 15832.11 78.8% 4) 3M 06/21/16 13995.98 - 16194.22 78.6% 5) Q2 16 06/30/16 13977.78 - 16340.13 78.38 6) 6M 09/21/16 13674.80 - 17168.10 79.1% 7) 03 16 09/30/16 13651.42 - 17274.70 79.28 8) 9M 12/21/16 13467.05 - 18064.30 80.6% 9) 04 16 12/31/16 13451.86 - 18172.93 80.7% 10) 12 03/21/17 13379.81 - 18852.34 80.8% 11) Q1 17 03/31/17 13388.76 - 18943.81 80.78 12) 2017 12/31/17 13744.26 - 20881.22 78.78 13) 2Y 03/21/18 13895.32 - 21391.25 78.2% 14) 2018 12/31/18 14335.14 - 23344.24 75.2% 15) 2019 12/31/19 14994.17 - 25863.56 72.0% Percent (8) 12613.52 13912.825212.12,6511.40, 7810.69 --/--/-- Spot Analyst Consensus 14797.93 N.A. Forward Range 15158.95 1SD Brazilian real Forecast Model Distribution with Analyst Estimates for 06/30/16 (Q2 16) Implied Probability Analyst Forecasts Track Annotate Zoom EURBRLO as of 03/21/16 Source Bloomberg BGN Range 1 Standard Deviation Price Range Prob 03/28/16 3.9212 - 4.1982 74.7% | 2) 1M 04/21/16 3.7895 - 4,386171.2% 3) 2M 05/19/16 3.7078 - 4.5416 72.1% 4) 3M 06/21/16 3.6471 - 4.6850 72.9% 5) Q2 16 06/30/16 3.6349 - 4.7292 73.0% 6) 6M 09/21/16 3.5384 - 5.0389 74.4% 7) Q3 16 09/30/16 3.5325 - 5.0732 74.4% 8) 9M 12/21/16 3.4910 - 5.3214 74.5% 9) Q4 16 12/31/16 3.4912 - 5.3550 74.5% 10 1Y 03/21/17 3.4994 - 5.5667 73.8% 11) Q1 17 03/31/17 3.5003 - 5.5985 73.6% 12) 2017 12/31/17 3.5608 - 6.2855 70.5% 13) 2Y 03/21/18 3.5886 - 6.4732 69.8% 14) 2018 12/31/18 3.4709 - 6.7237 66.0% 15) 2019 12/31/19 3.3686 - 7.0009 62.4% Percent (8) 3.0029 3.6048 4.2067 4,8085 5.4104 |--/--/-- Spot Analyst Consensus 4.0685 N.A. Forward Range 4.1820 1SD Russian ruble Forecast Model Distribution with Analyst Estimates for 06/30/16 (Q2 16) Implied Probability Analyst Forecasts + Track Annotate Q. Zoom 6.00 EURRUBO as of 03/21/16 Source Bloomberg BGN Range 1 Standard Deviation Date Price Range Prob 1) 1W 03/28/16 73.9484 - 79.1459 71.8% 2) 1M 04/21/16 71.3822 - 82.8079 72.1% 3) 2M 05/19/16 69.5245 - 85.9128 73.28 4) 3M 06/21/16 67.7699 - 89.0767 74.5% 5) Q2 16 06/30/16 67.3254 - 89.8979 74.7% 6) 6M 09/21/16 64.7919 - 95.9053 75.3% 7) Q3 16 09/30/16 64.6251 - 96.5250 75.2% 8) 9M 12/21/16 63.6732 - 100.7700 74.0% 9) 04 16 12/31/16 63.6163 - 101.3095 73.8% 10) 14 03/21/17 63.4336 - 104.6289 72.4% 11) 01 17 03/31/17 63.4186 - 105.1028 72.18 12) 2017 12/31/17 64.1622 - 115.5764 66.6% 13) 2Y 03/21/18 64.6205 - 118.4913 65.6% 14) 2018 12/31/18 65.7028 - 129,8974 62.8% 15) 2019 12/31/19 67.7420 - 144.6226 59.9% Percent (8) 54.2898 66.7046 79.1195 91.5344,03.9493 Spot Analyst Consensus 76.2736 80.4201 Forward Range 78.6116 1SD South African rand Forecast Model Distribution with Analyst Estimates for 06/30/16 (Q2 16) Implied Probability Analyst Forecasts + Track Annotate Q. Zoom EURZAR O = as of 03/21/16 - Source Bloomberg BGN Range 1 Standard Deviation Date Price Range Prob 1) 1W 03/28/16 16.5766 - 17.7118 74.7% 2) 1M 04/21/16 16.0626 - 18.4298 2,5% 3) 2M 05/19/16 15.7313 - 18.9776 73.6% 4) 3M 06/21/16 15.4586 - 19.4937 74.5% 5) Q2 16 06/30/16 15.3887 - 19.6606 74.78 6) 6M 09/21/16 14.9115 - 20.7846 75.8% 7) 03 16 09/30/16 14.8727 - 20.9166 75.9%) 8) 9M 12/21/16 14.6466 - 21.8205 75.9% 9) 04 16 12/31/16 14.6341 - 21.9410 75.8% 10) 1Y 03/21/17 14.5849 - 22.6917 75.18 11) Q1 17 03/31/17 14.5776 - 22.8136 74.9% 12) 2017 12/31/17 14.7879 - 25.2173 70.8% 13) 2Y 03/21/18 14.8974 - 25.8615 69.9% 14) 2018 12/31/18 16.2863 - 27.9498 68.1% 15) 2019 12/31/19 17.2508 - 31.4231 63.78 Percent (8) 12.9216 15.2712 17.6208 19.9704 22.3199 16) --/--/-- --/--/-- Spot Analyst Consensus 17.1077 N.A. Forward Range 17.5247 1SD 17)


