Answered step by step
Verified Expert Solution
Link Copied!

Question

1 Approved Answer

A sample of birth weights of 22 girls was taken. Below are the results (in g): 3769.5 2964.8 3196.6 3544.7 2618.2 3156 2634.1 3916.5 2919.2
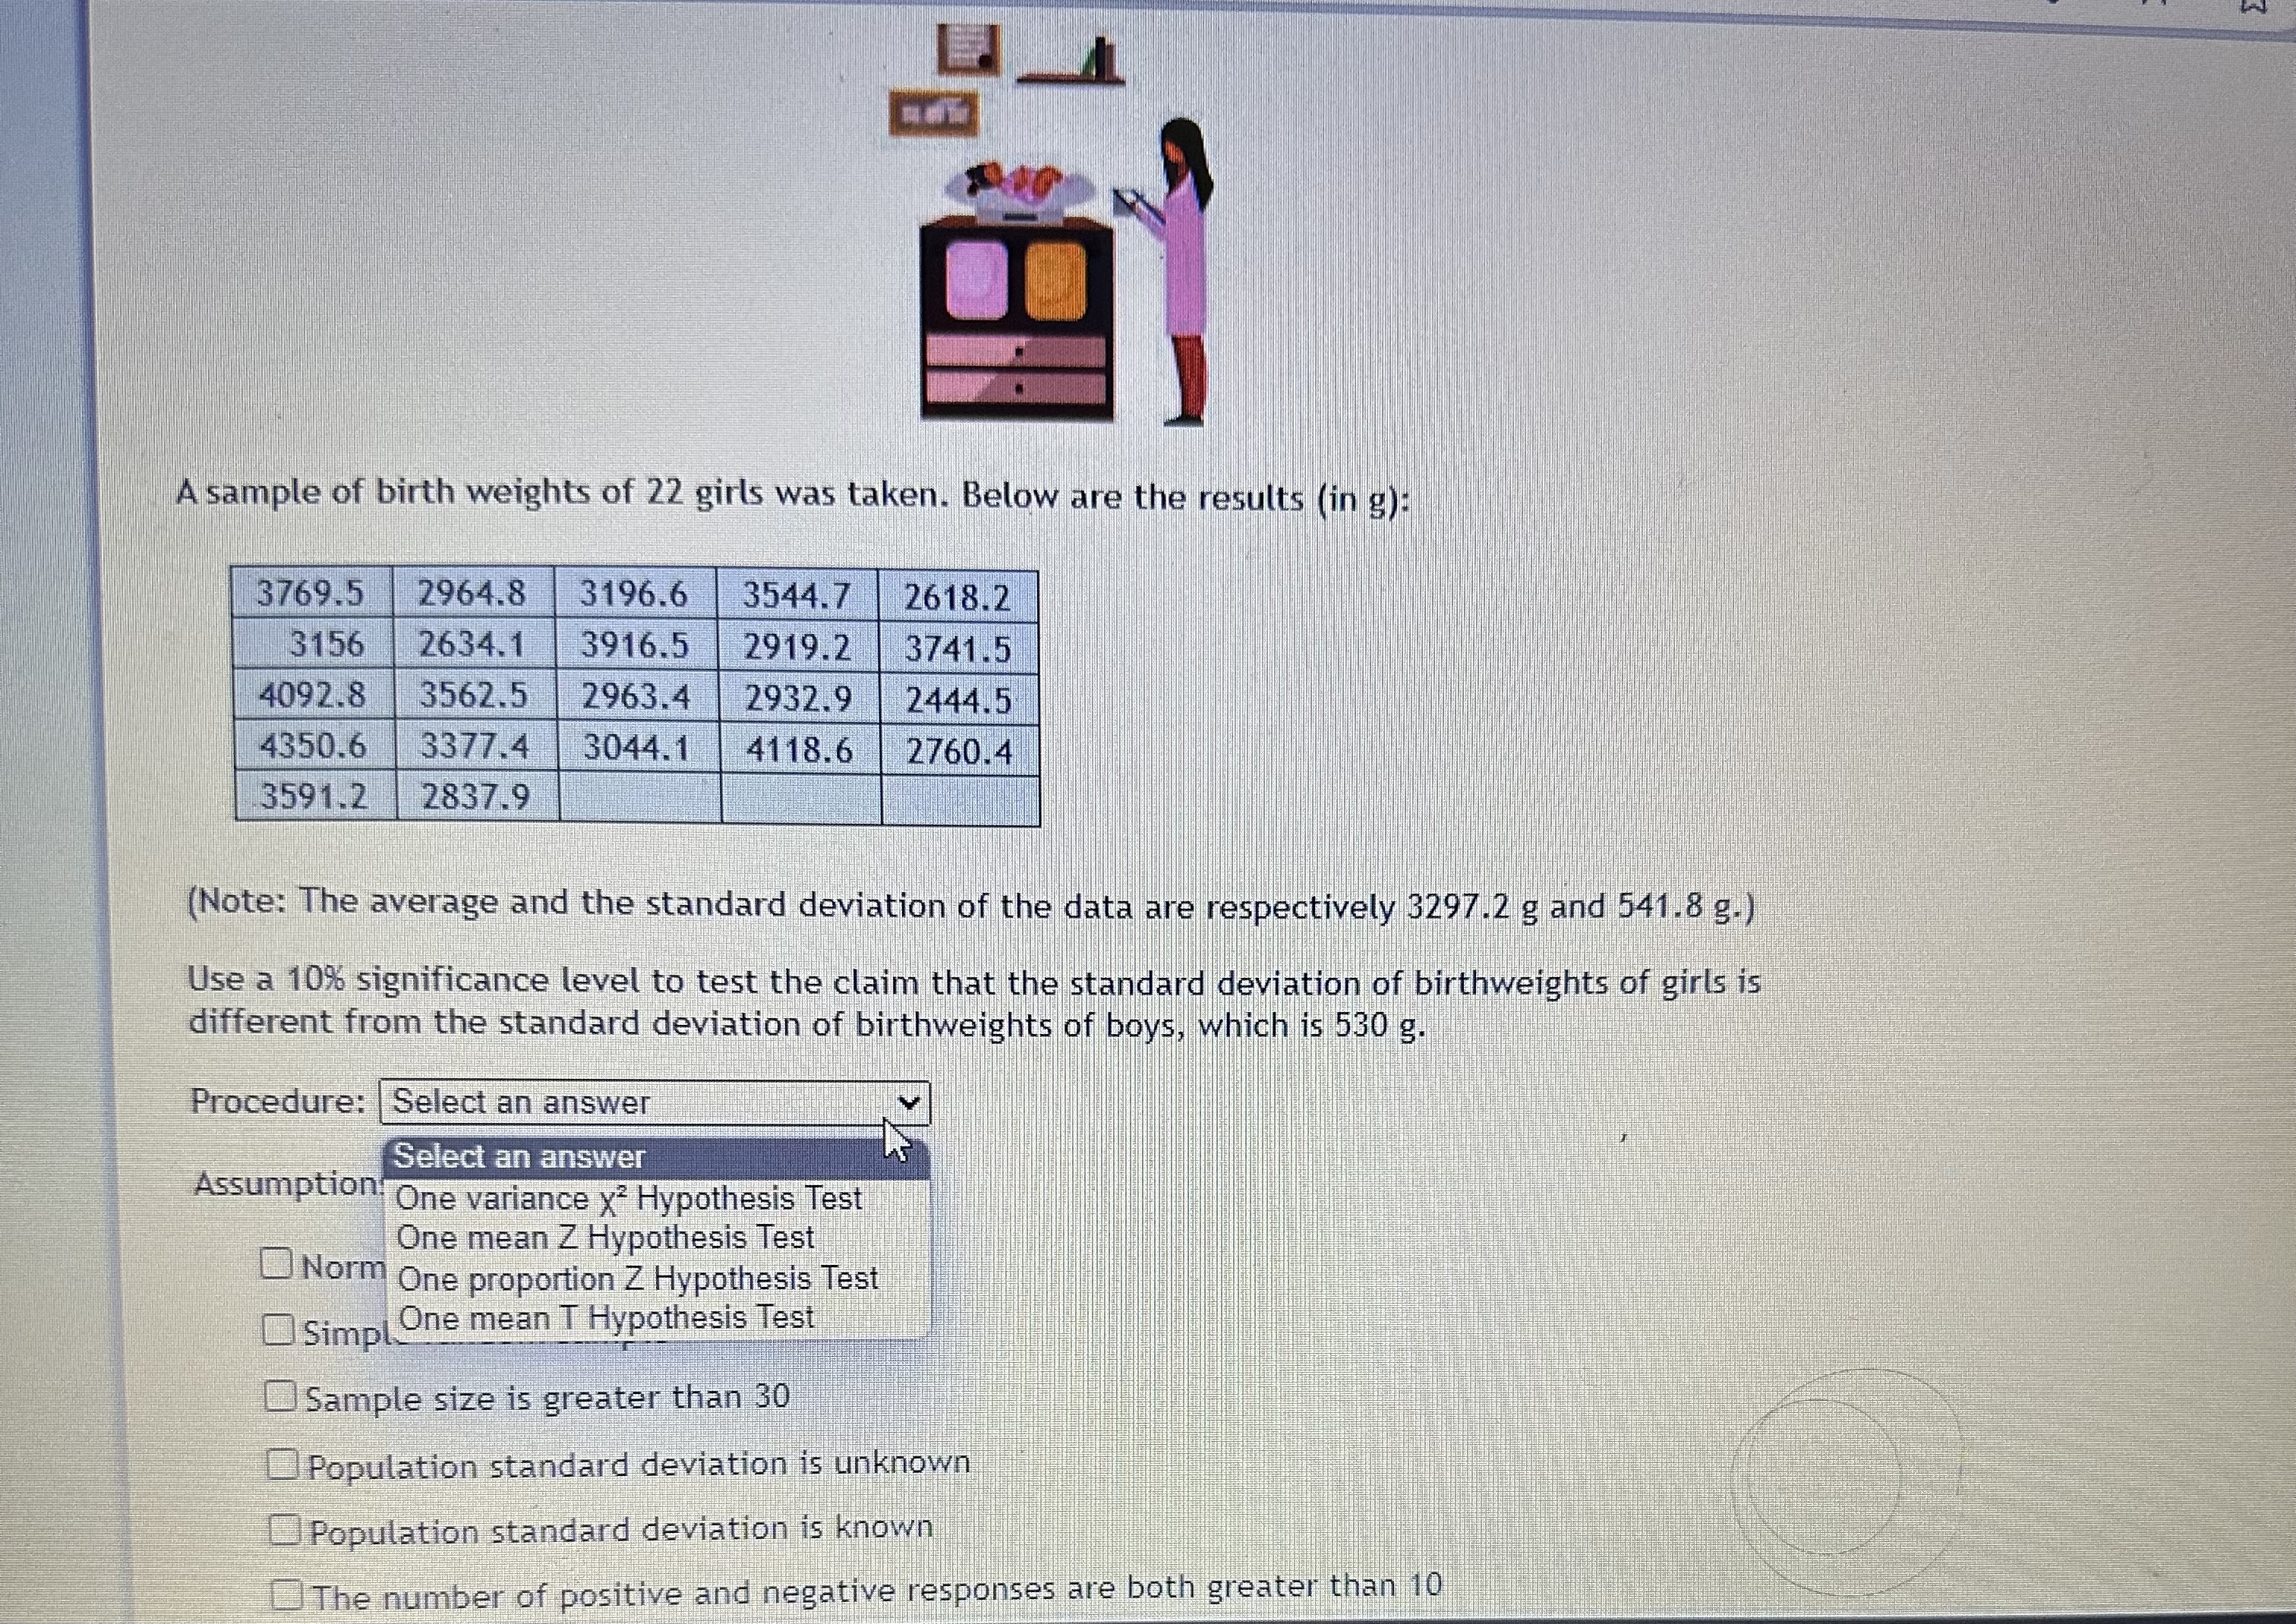
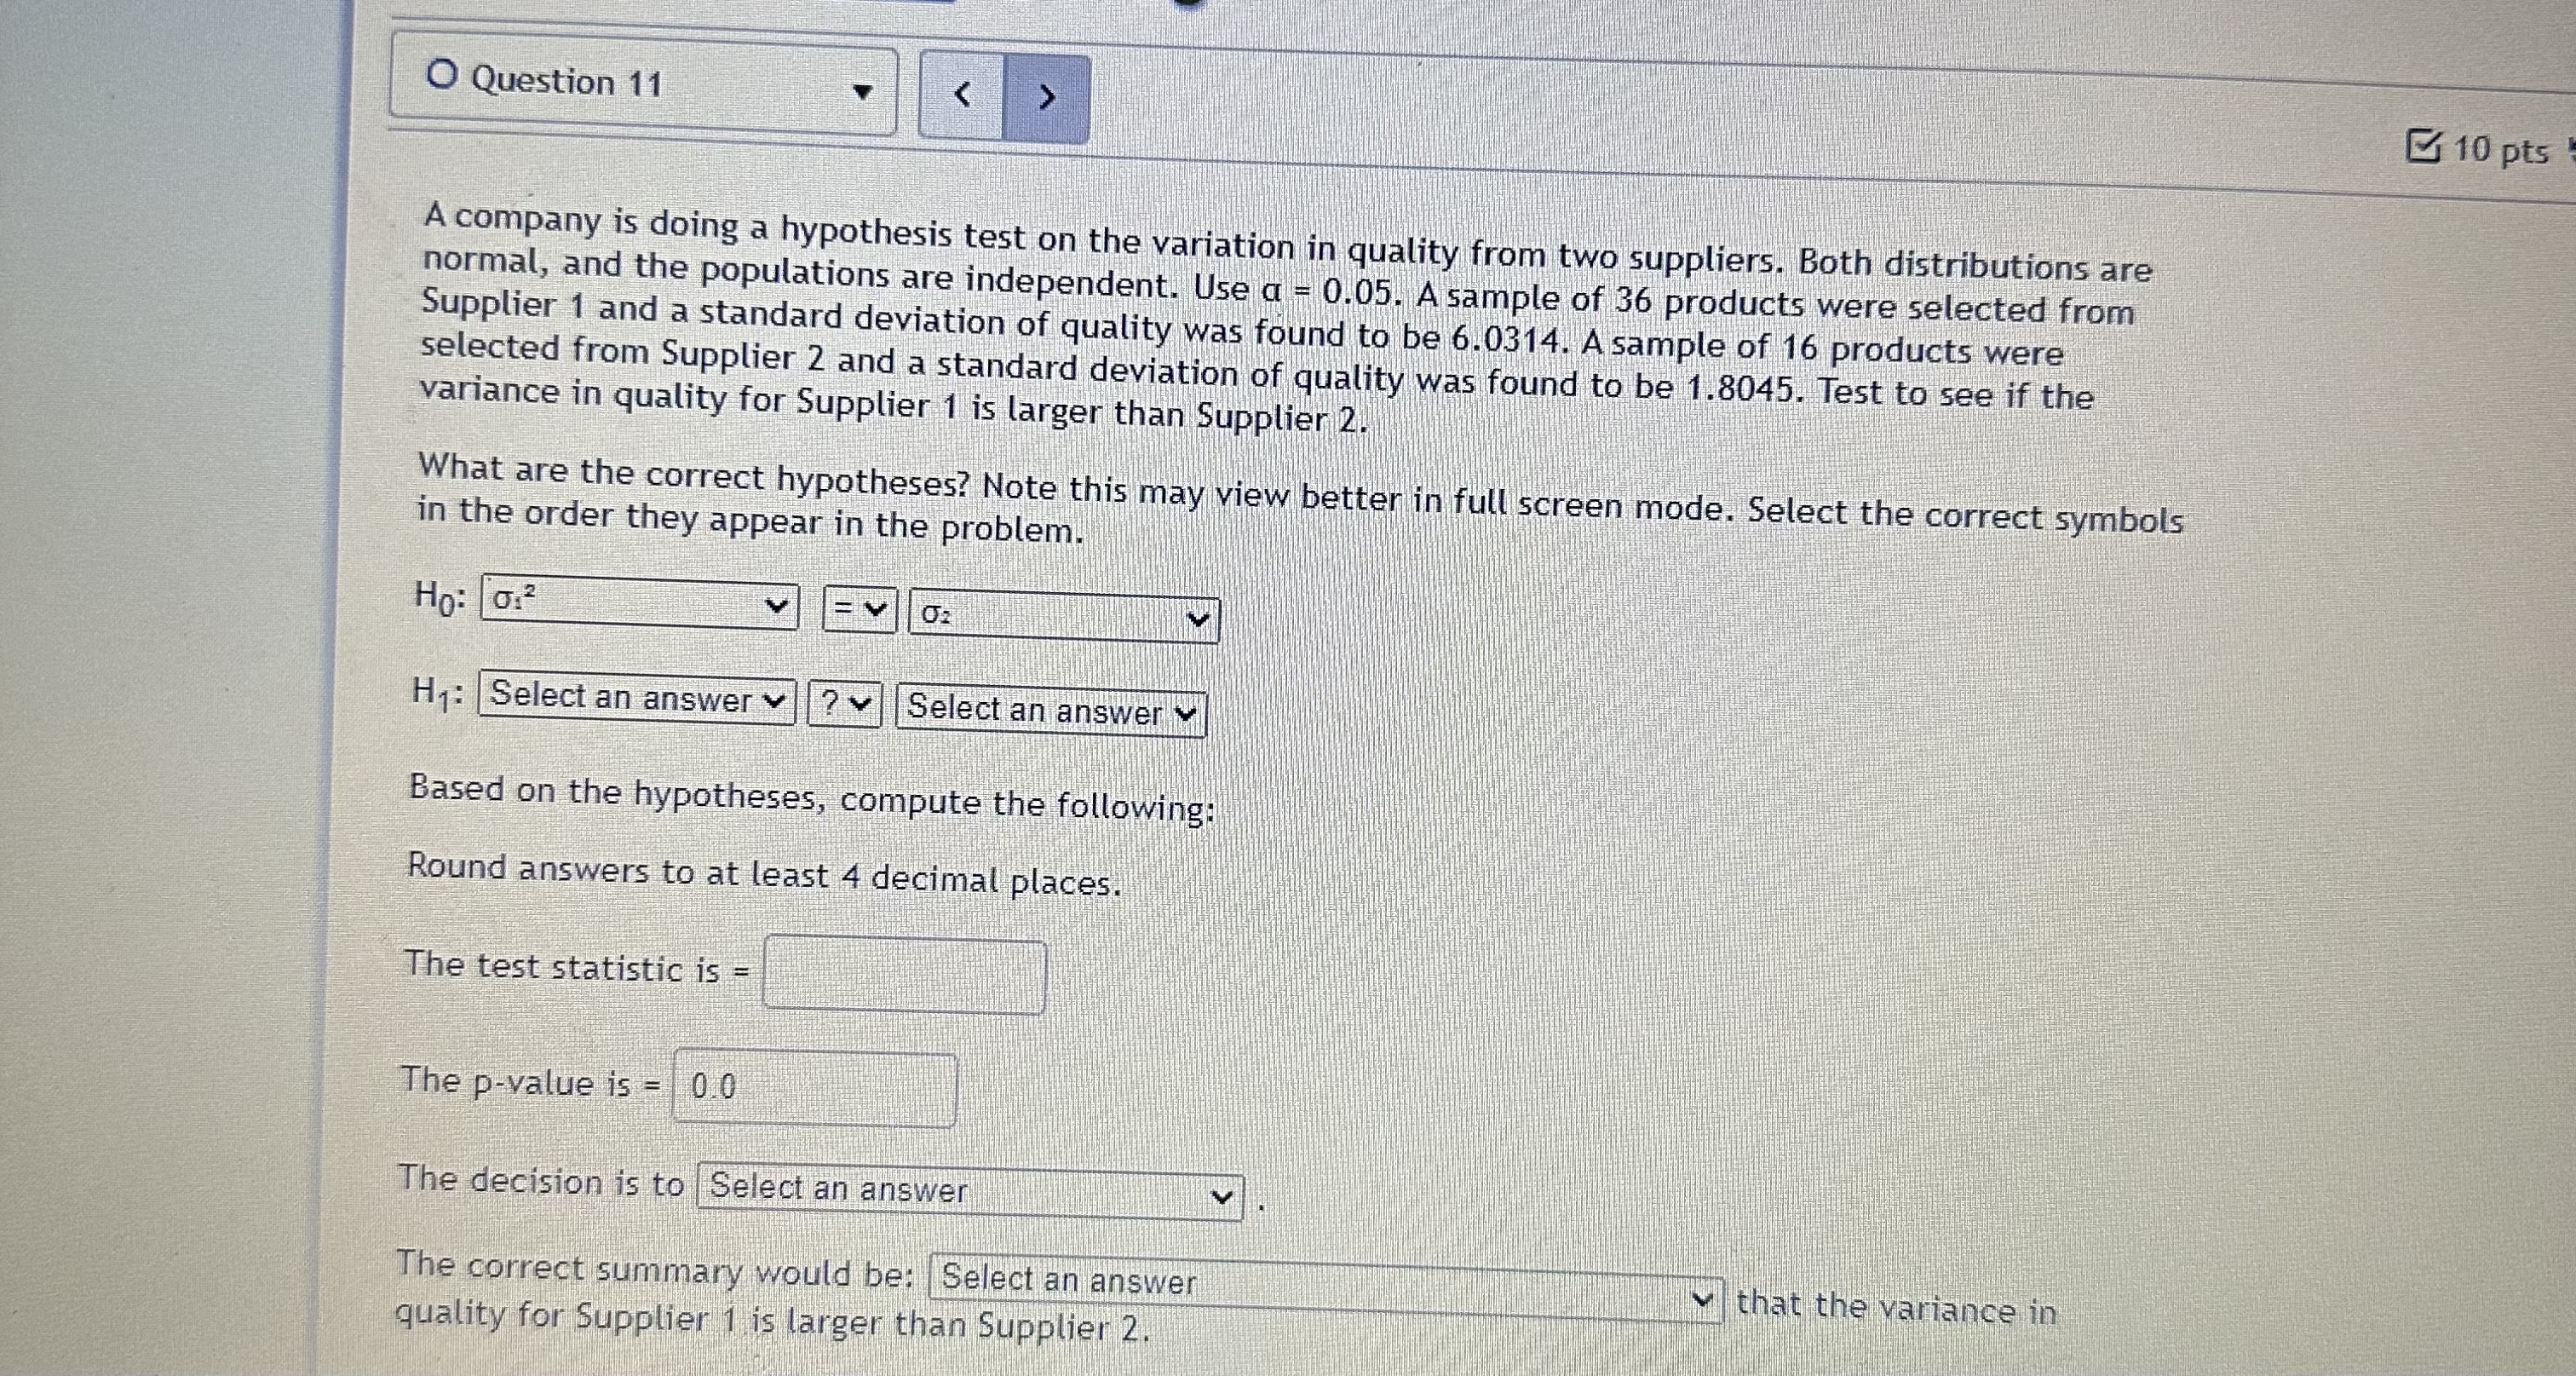
image text in transcribedimage text in transcribed
A sample of birth weights of 22 girls was taken. Below are the results (in g): 3769.5 2964.8 3196.6 3544.7 2618.2 3156 2634.1 3916.5 2919.2 3741.5 4092.8 3562.5 2963.4 2932.9 2444.5 4350.6 3377.4 3044.1 4118.6 2760.4 3591.2 2837.9 (Note: The average and the standard deviation of the data are respectively 3297.2 g and 541.8 g.) Use a 10% significance level to test the claim that the standard deviation of birthweights of girls is different from the standard deviation of birthweights of boys, which is 530 g. Procedure: |Select an answer Select an answer Assumption One variance x2 Hypothesis Test One mean Z Hypothesis Test Norm One proportion Z Hypothesis Test Simp One mean T Hypothesis Test Sample size is greater than 30 Population standard deviation is unknown Population standard deviation is known The number of positive and negative responses are both greater than 10O Question 11 10 pts A company is doing a hypothesis test on the variation in quality from two suppliers. Both distributions are normal, and the populations are independent. Use a = 0.05. A sample of 36 products were selected from Supplier 1 and a standard deviation of quality was found to be 6.0314. A sample of 16 products were selected from Supplier 2 and a standard deviation of quality was found to be 1.8045. Test to see if the variance in quality for Supplier 1 is larger than Supplier 2. What are the correct hypotheses? Note this may view better in full screen mode. Select the correct symbols in the order they appear in the problem. Ho: 0:2 H1: Select an answer v ? v Select an answer v Based on the hypotheses, compute the following: Round answers to at least 4 decimal places. The test statistic is = The p-value is = 0.0 The decision is to Select an answer The correct summary would be: Select an answer that the variance in quality for Supplier 1 is larger than Supplier 2

Step by Step Solution

There are 3 Steps involved in it

Step: 1

blur-text-image

Get Instant Access to Expert-Tailored Solutions

See step-by-step solutions with expert insights and AI powered tools for academic success

Step: 2

blur-text-image

Step: 3

blur-text-image

Ace Your Homework with AI

Get the answers you need in no time with our AI-driven, step-by-step assistance

Get Started

Recommended Textbook for

Intro Stats

Authors: Richard D. De Veaux, Paul F. Velleman, David E. Bock

3rd edition

321533283, 321533289, 9780321463708, 9780321503848, 9780321503800, 9780321499431, 9780321499417, 978-0321500458

More Books

Students also viewed these Mathematics questions