Question
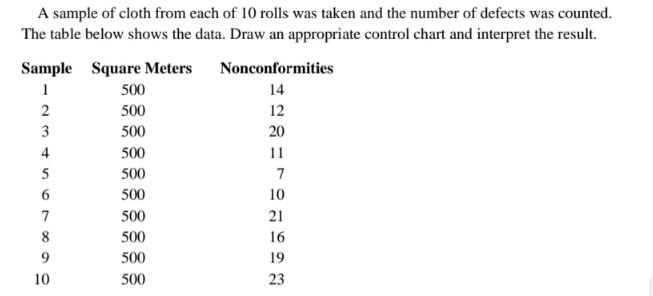
A sample of cloth from each of 10 rolls was taken and the number of defects was counted. The table below shows the data.

A sample of cloth from each of 10 rolls was taken and the number of defects was counted. The table below shows the data. Draw an appropriate control chart and interpret the result. Sample Square Meters 1 23 4 5 6 7 8 9 10 500 500 500 500 500 500 500 500 500 500 Nonconformities 14 12 20 11 7 10 21 16 19 23
Step by Step Solution
3.39 Rating (155 Votes )
There are 3 Steps involved in it
Step: 1

Get Instant Access to Expert-Tailored Solutions
See step-by-step solutions with expert insights and AI powered tools for academic success
Step: 2

Step: 3

Ace Your Homework with AI
Get the answers you need in no time with our AI-driven, step-by-step assistance
Get StartedRecommended Textbook for
Business Statistics In Practice
Authors: Bruce Bowerman, Richard OConnell, Emilly Murphree
7th Edition
0077534840, 9780077534844
Students also viewed these General Management questions
Question
Answered: 1 week ago
Question
Answered: 1 week ago
Question
Answered: 1 week ago
Question
Answered: 1 week ago
Question
Answered: 1 week ago
Question
Answered: 1 week ago
Question
Answered: 1 week ago
Question
Answered: 1 week ago
Question
Answered: 1 week ago
Question
Answered: 1 week ago
Question
Answered: 1 week ago
Question
Answered: 1 week ago
Question
Answered: 1 week ago
Question
Answered: 1 week ago
Question
Answered: 1 week ago
Question
Answered: 1 week ago
Question
Answered: 1 week ago
Question
Answered: 1 week ago
Question
Answered: 1 week ago
Question
Answered: 1 week ago
Question
Answered: 1 week ago
Question
Answered: 1 week ago
View Answer in SolutionInn App


