Question
A sample of fifth-grade classes was studied in an article. One of the variables collected was the class size in terms of student-to-faculty ratio. The
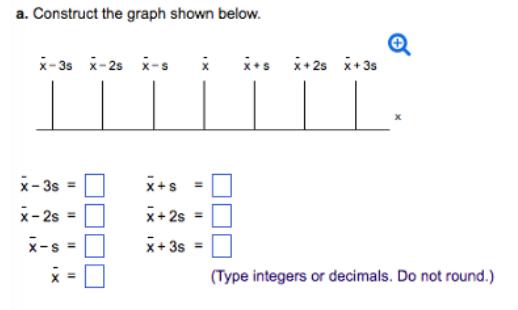
A sample of fifth-grade classes was studied in an article. One of the variables collected was the class size in terms of student-to-faculty ratio. The student-to-faculty ratios of the 73 fifth-grade classes sampled have a mean of 16.82 and a standard deviation of 2.31 . Complete parts (a) through (d) below.
a. Construct the graph shown below. x-3s x-25 i-s **s *+25 *+ 3s x- 3s = x+s x-2s = x+ 2s = x-s = x+ 3s (Type integers or decimals. Do not round.)
Step by Step Solution
3.40 Rating (163 Votes )
There are 3 Steps involved in it
Step: 1

Get Instant Access to Expert-Tailored Solutions
See step-by-step solutions with expert insights and AI powered tools for academic success
Step: 2

Step: 3

Ace Your Homework with AI
Get the answers you need in no time with our AI-driven, step-by-step assistance
Get StartedRecommended Textbook for
Elementary Statistics
Authors: Neil A. Weiss
8th Edition
321691237, 978-0321691231
Students also viewed these Accounting questions
Question
Answered: 1 week ago
Question
Answered: 1 week ago
Question
Answered: 1 week ago
Question
Answered: 1 week ago
Question
Answered: 1 week ago
Question
Answered: 1 week ago
Question
Answered: 1 week ago
Question
Answered: 1 week ago
Question
Answered: 1 week ago
Question
Answered: 1 week ago
Question
Answered: 1 week ago
Question
Answered: 1 week ago
Question
Answered: 1 week ago
Question
Answered: 1 week ago
Question
Answered: 1 week ago
Question
Answered: 1 week ago
Question
Answered: 1 week ago
Question
Answered: 1 week ago
Question
Answered: 1 week ago
Question
Answered: 1 week ago
Question
Answered: 1 week ago
Question
Answered: 1 week ago
View Answer in SolutionInn App


