Answered step by step
Verified Expert Solution
Link Copied!

Question

1 Approved Answer

A sample ten fishing lures were selected and the prices were recorded. The results are displayed in the chart below. Cost of Fishing Lures: Lake
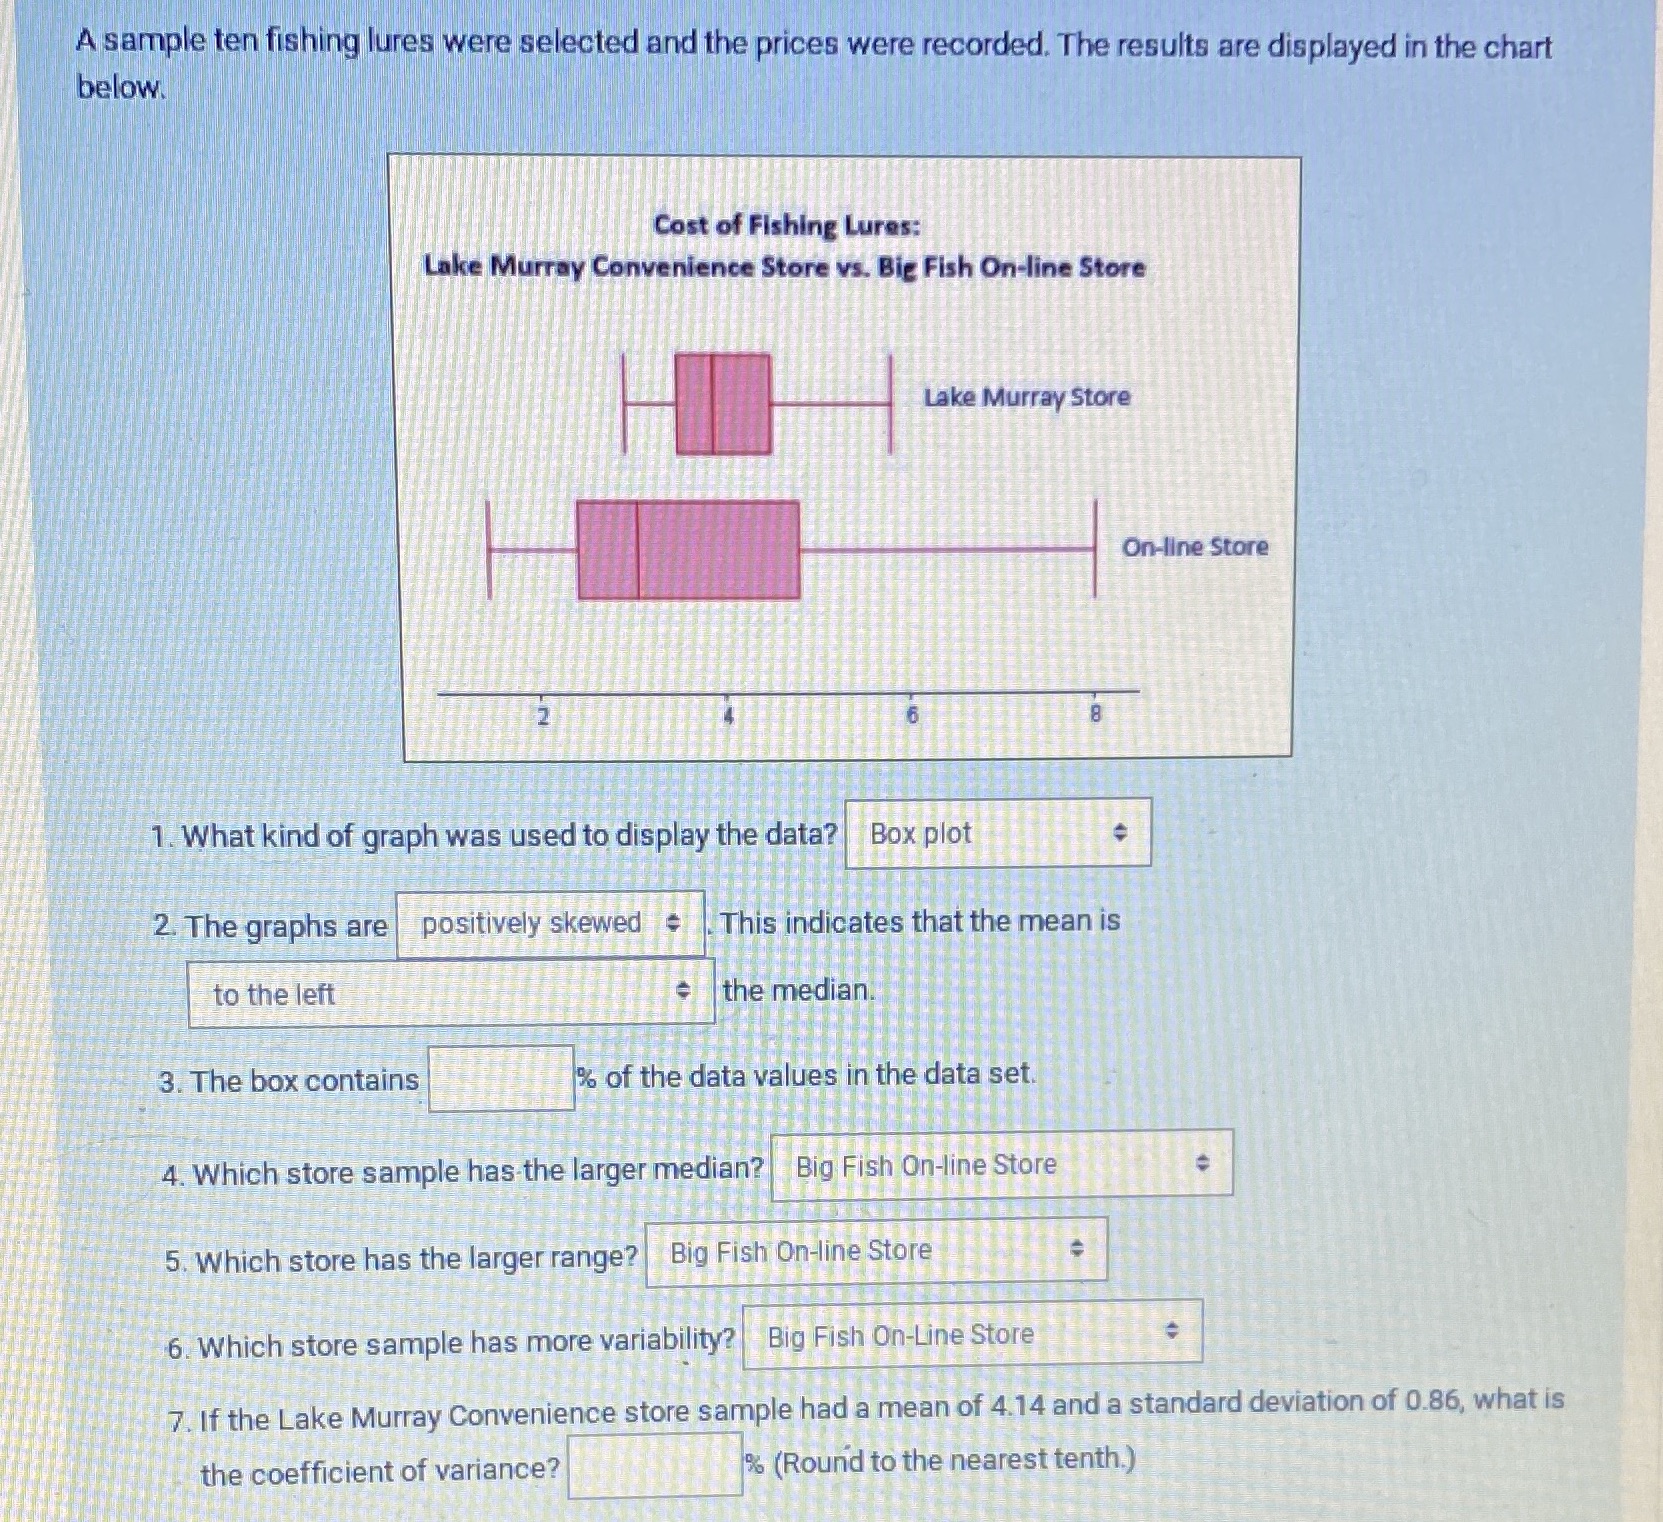
image text in transcribed
A sample ten fishing lures were selected and the prices were recorded. The results are displayed in the chart below. Cost of Fishing Lures: Lake Murray Convenience Store vs. Big Fish On-line Store Lake Murray Store On-line Store 1. What kind of graph was used to display the data? Box plot 2. The graphs are positively skewed This indicates that the mean is to the left the median. 3. The box contains of the data values in the data set. 4. Which store sample has the larger median? Big Fish On-line Store 5. Which store has the larger range? |Big Fish On-line Store 6. Which store sample has more variability? Big Fish On-Line Store 7. If the Lake Murray Convenience store sample had a mean of 4.14 and a standard deviation of 0.86, what is the coefficient of variance? * (Round to the nearest tenth.)

Step by Step Solution

There are 3 Steps involved in it

Step: 1

blur-text-image

Get Instant Access to Expert-Tailored Solutions

See step-by-step solutions with expert insights and AI powered tools for academic success

Step: 2

blur-text-image_2

Step: 3

blur-text-image_3

Ace Your Homework with AI

Get the answers you need in no time with our AI-driven, step-by-step assistance

Get Started

Recommended Textbook for

Calculus I With Integrated Precalculus

Authors: Laura Taalman

1st Edition

1464153027, 9781464153020

More Books

Students also viewed these Mathematics questions

Question

3. Define the roles individuals play in a group

Answered: 1 week ago