

Answered step by step
Verified Expert Solution
Question
1 Approved Answer
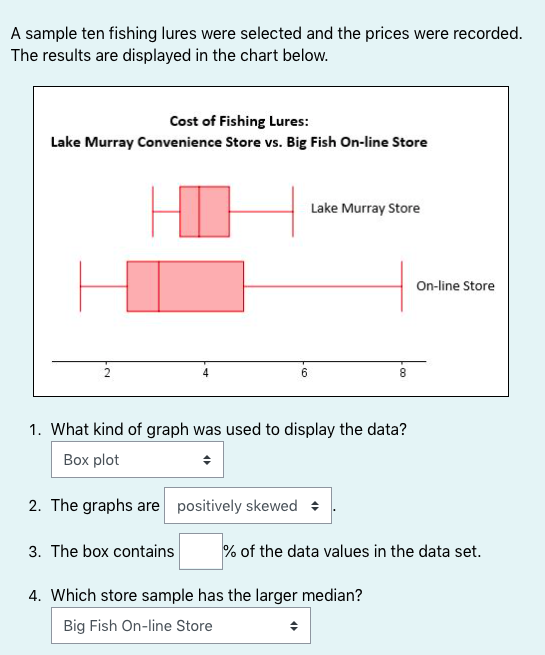
A sample ten fishing lures were selected and the prices were recorded. The results are displayed in the chart below. Cost of Fishing Lures: Lake

Step by Step Solution
There are 3 Steps involved in it
Step: 1

Get Instant Access to Expert-Tailored Solutions
See step-by-step solutions with expert insights and AI powered tools for academic success
Step: 2

Step: 3
Ace Your Homework with AI
Get the answers you need in no time with our AI-driven, step-by-step assistance
Get Started
Auditing Cases An Active Learning Approach
Authors: Mark S. Beasley, Frank A. Buckless, Steven M. Glover, Douglas F. Prawitt
2nd Edition
0130674842, 978-0130674845