Answered step by step
Verified Expert Solution
Question
1 Approved Answer
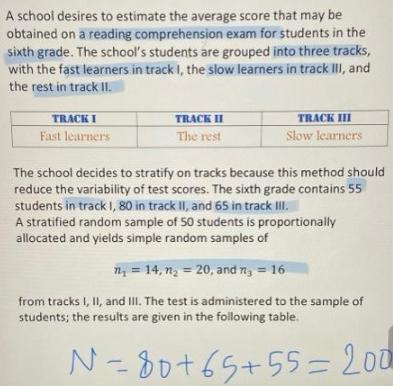
A school desires to estimate the average score that may be obtained on a reading comprehension exam for students in the sixth grade. The


A school desires to estimate the average score that may be obtained on a reading comprehension exam for students in the sixth grade. The school's students are grouped into three tracks, with the fast learners in track I, the slow learners in track III, and the rest in track II. TRACK I Fast learners TRACK II The rest TRACK III Slow learners The school decides to stratify on tracks because this method should reduce the variability of test scores. The sixth grade contains 55 students in track 1, 80 in track II, and 65 in track II. A stratified random sample of 50 students is proportionally allocated and yields simple random samples of n; = 14, n, = 20, and n, = 16 from tracks I, II, and II. The test is administered to the sample of students; the results are given in the following table. N=80+65+55= 200 Grade 6 student's test results for three tracks Track I Track II Track II N = 55 n, = 14 80 N = 80 n = 20 85 Ny = 65 = 16 53 91 72 42 92 90 82 81 32 14 68 81 48 53 36 61 85 62 75 59 31 31 72 79 53 68 65 42 87 61 73 52 29 30 85 83 65 71 43 39 78 61 19 32 49 59 599 69 42 1295 a. Estimate the average score for the sixth grade, and place a bound on the error of estimation. Construct parallel box plots for these data and comment on the patterns you see. Do you think there could be a problem in placing students in tracks? Estimate the difference in average scores between track I and track II students. Are track I students significantly better, on the average, than track II students? d. Find the sample size required to estimate the average score, with a bound of four points on the error of estimation. Use proportional allocation.
Step by Step Solution
★★★★★
3.42 Rating (158 Votes )
There are 3 Steps involved in it
Step: 1
Solution Given that Foom the below table it shows the re...
Get Instant Access to Expert-Tailored Solutions
See step-by-step solutions with expert insights and AI powered tools for academic success
Step: 2

Step: 3

Ace Your Homework with AI
Get the answers you need in no time with our AI-driven, step-by-step assistance
Get Started


