A similar mega structure was constructed at head of major canal command. The project was completed in 11 years and useful life of project was assumed to be 40 years. The capital cost, O&M and benefits are shown in Table 1. By using the economic analysis technique:
Analyze the:
i). Benefit-cost ratio of the project
ii). EIRR and comment upon opportunity cost.
Discounted Factor 13%
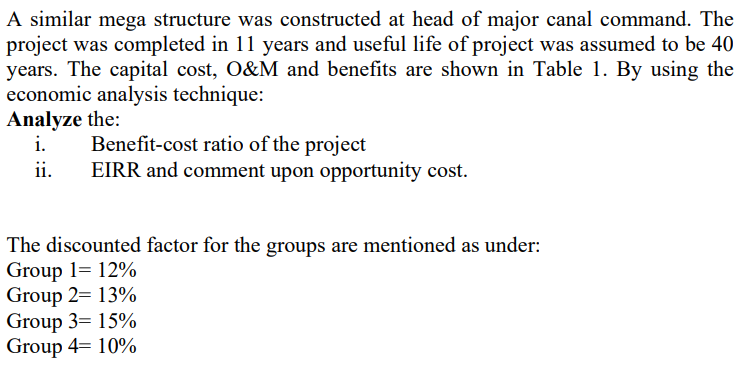
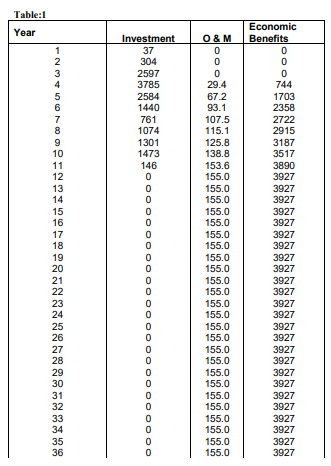
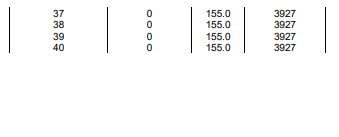
A similar mega structure was constructed at head of major canal command. The project was completed in 11 years and useful life of project was assumed to be 40 years. The capital cost, O&M and benefits are shown in Table 1. By using the economic analysis technique: Analyze the: i. Benefit-cost ratio of the project ii. EIRR and comment upon opportunity cost. The discounted factor for the groups are mentioned as under: Group 1= 12% Group 2= 13% Group 3= 15% Group 4= 10% Table:1 Year UNAN 1 2 2 3 4 5 6 7 8 9 10 Investment 37 304 2597 3785 2584 1440 761 1074 1301 1473 146 0 0 11 12 13 14 15 16 17 18 19 20 21 22 23 24 25 26 27 28 29 30 31 32 33 34 35 36 0 0 0 0 0 0 0 Economic Benefits 0 0 0 744 1703 2358 2722 2915 3187 3517 3890 3927 3927 3927 3927 3927 3927 3927 3927 3927 3927 3927 3927 3927 3927 3927 3927 3927 3927 3927 3927 3927 3927 3927 3927 3927 O&M 0 0 0 29.4 67.2 93.1 107.5 115.1 125.8 138.8 153.6 155.0 155.0 155.0 155.0 155.0 155.0 155.0 155.0 155.0 155.0 155.0 155.0 155.0 155.0 155.0 155.0 155.0 155.0 155.0 155.0 155.0 155.0 155.0 155.0 155.0 0 0 0 0 OOOOOO 37 38 39 40 155.0 155.0 155.0 155.0 0 0 3927 3927 3927 3927 A similar mega structure was constructed at head of major canal command. The project was completed in 11 years and useful life of project was assumed to be 40 years. The capital cost, O&M and benefits are shown in Table 1. By using the economic analysis technique: Analyze the: i. Benefit-cost ratio of the project ii. EIRR and comment upon opportunity cost. The discounted factor for the groups are mentioned as under: Group 1= 12% Group 2= 13% Group 3= 15% Group 4= 10% Table:1 Year UNAN 1 2 2 3 4 5 6 7 8 9 10 Investment 37 304 2597 3785 2584 1440 761 1074 1301 1473 146 0 0 11 12 13 14 15 16 17 18 19 20 21 22 23 24 25 26 27 28 29 30 31 32 33 34 35 36 0 0 0 0 0 0 0 Economic Benefits 0 0 0 744 1703 2358 2722 2915 3187 3517 3890 3927 3927 3927 3927 3927 3927 3927 3927 3927 3927 3927 3927 3927 3927 3927 3927 3927 3927 3927 3927 3927 3927 3927 3927 3927 O&M 0 0 0 29.4 67.2 93.1 107.5 115.1 125.8 138.8 153.6 155.0 155.0 155.0 155.0 155.0 155.0 155.0 155.0 155.0 155.0 155.0 155.0 155.0 155.0 155.0 155.0 155.0 155.0 155.0 155.0 155.0 155.0 155.0 155.0 155.0 0 0 0 0 OOOOOO 37 38 39 40 155.0 155.0 155.0 155.0 0 0 3927 3927 3927 3927