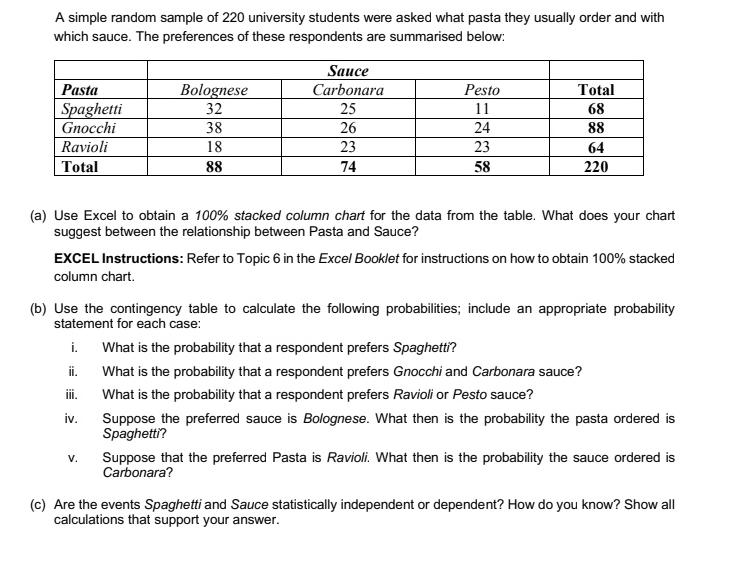
A simple random sample of 220 university students were asked what pasta they usually order and...
Fantastic news! We've Found the answer you've been seeking!
Question:
Transcribed Image Text:
A simple random sample of 220 university students were asked what pasta they usually order and with which sauce. The preferences of these respondents are summarised below: Sauce Bolognese Pasta Spaghetti Gnocchi Carbonara Pesto Total 32 25 11 68 38 26 24 88 Ravioli 18 23 23 64 Total 88 74 58 220 (a) Use Excel to obtain a 100% stacked column chart for the data from the table. What does your chart suggest between the relationship between Pasta and Sauce? EXCEL Instructions: Refer to Topic 6 in the Excel Booklet for instructions on how to obtain 100% stacked column chart. (b) Use the contingency table to calculate the following probabilities; include an appropriate probability statement for each case: i. What is the probability that a respondent prefers Spaghetti? ii. What is the probability that a respondent prefers Gnocchi and Carbonara sauce? iii. What is the probability that a respondent prefers Ravioli or Pesto sauce? iv. Suppose the preferred sauce is Bolognese. What then is the probability the pasta ordered is Spaghetti? Suppose that the preferred Pasta is Ravioli. What then is the probability the sauce ordered is Carbonara? V. (c) Are the events Spaghetti and Sauce statistically independent or dependent? How do you know? Show all calculations that support your answer. A simple random sample of 220 university students were asked what pasta they usually order and with which sauce. The preferences of these respondents are summarised below: Sauce Bolognese Pasta Spaghetti Gnocchi Carbonara Pesto Total 32 25 11 68 38 26 24 88 Ravioli 18 23 23 64 Total 88 74 58 220 (a) Use Excel to obtain a 100% stacked column chart for the data from the table. What does your chart suggest between the relationship between Pasta and Sauce? EXCEL Instructions: Refer to Topic 6 in the Excel Booklet for instructions on how to obtain 100% stacked column chart. (b) Use the contingency table to calculate the following probabilities; include an appropriate probability statement for each case: i. What is the probability that a respondent prefers Spaghetti? ii. What is the probability that a respondent prefers Gnocchi and Carbonara sauce? iii. What is the probability that a respondent prefers Ravioli or Pesto sauce? iv. Suppose the preferred sauce is Bolognese. What then is the probability the pasta ordered is Spaghetti? Suppose that the preferred Pasta is Ravioli. What then is the probability the sauce ordered is Carbonara? V. (c) Are the events Spaghetti and Sauce statistically independent or dependent? How do you know? Show all calculations that support your answer.
Expert Answer:
Answer rating: 100% (QA)
Link for 100 stacked column chart is also being attached here httpsdrivegoog... View the full answer
Related Book For
Posted Date:
Students also viewed these mathematics questions
-
A market researcher selects a simple random sample of n = 100 Twitter users from a population of over 100 million Twitter registered users. After analyzing the sample, she states that she has 95%...
-
Data set: ChiSq a. Take a simple random sample of size n = 40 from the ChiSq data. Create a bootstrap distribution of the median by taking 1000 resamples (with replacement). Describe the shape of the...
-
A market researcher selects a simple random sample of n = 100 Twitter users from a population of over 100 million Twitter registered users. After analyzing the sample, she states that she has 95%...
-
Below are three independent and unrelated errors. a. On December 31, 2020, Wolfe-Bache Corporation failed to accrue salaries expense of $1,800. In January 2021, when it paid employees for the...
-
Kelly was active in the market, buying and selling stocks for her own account. Below are a series of transactions Kelly initiated during the last quarter of 2013: The XYZ stock sold on 11/01 had been...
-
Find two positive numbers whose sum is 50 and whose product is as large as possible.
-
Starting with Eqs. (15-74a) and (15-74b), derive Eq. (15-74c). Note: Because \(\mathrm{x}_{\mathrm{W}}=1\) \(-\mathrm{x}_{\mathrm{E}}, \mathrm{x}_{\mathrm{W}}\) is not a constant. B A and In Yw...
-
Working Capital Cash flow Cycle The Christic Corporation is trying to determine the effect of its inventory turnover ratio and days sales outstanding (DSO) on its cash flow cycle. Christies sales...
-
Q.5. Dash.pk Company is an e-business which trades solely over the internet. In the recent year end, Company had sales of Rs. 30 million with contribution to sales ratio of 25%. All sales were on 30...
-
Explain why correctly owning assets is important to the personal finances of people, especially couples.
-
solve by gaussian elimination x 1 + x 2 + 3 x 3 = 2 , - x 1 - 2 x 2 + 4 x 3 = - 4 , x 1 - 6 x 2 + 5 x 3 = - 1 2
-
The following data apply to Stratford Ltd Work in process inventory, beginning of the year $ 9 000 Manufacturing overhead applied during the year $ 20 000 Work in process inventory, end of the year $...
-
Please, draft and explain a termination provision in a product distribution agreement. This will require you to think about the different reasons for which your client might wish to terminate the...
-
What is deployment? What is web server ? What are the Types of URL patterns? What are the types of communicate to servlet program? Define Form Validation. What are the Limitations with servlets?
-
The following problem was the basis for the advocacy exercise last year. What arguments about an appropriate sentence should be made by (a) counsel for the prosecution (b) counsel for Lote Doe? Just...
-
A projectile is launched from the ground with an initial speed of 1 2 . 0 7 m / s at an angle of 2 0 . 0 2 above the horizontal. Neglecting air resistance, calculate the total time of flight traveled...
-
PLEASE USE EFFICIENT FRONTIER TO SOLVE THIS PROBLEM. PROBLEM 2 DATA WAS PROVIDED. THANK YOU.
-
The tractor is used to lift the 150-kg load B with the 24-mlong rope, boom, and pulley system. If the tractor travels to the right at a constant speed of 4 m/s, determine the tension in the rope when...
-
The Wechsler Adult Intelligence Scale measures IQ scores with a test designed so that the mean is 100 and the standard deviation is 15. Consider the group of IQ scores that are unusual. What are the...
-
A study was conducted of 531 persons injured in bicycle crashes, and randomly selected sample results are summarized in the accompanying table. The TI-83/84 Plus calculator results also are shown. At...
-
The table lists the distance d (meters) above the ground for an object dropped in a vacuum from a height of 300 m. The time t (in sec) is the time after the object has been released. Construct a...
-
Recording and processing information about a transaction at the time it takes place is referred to as which of the following? a. batch processing b. online, real-time processing c. captured...
-
Examine Table 2-1 and discuss how the various information needs would be collected and reported by a companys AIS. Table 2-1 Overview of S&S's Business Processes, Key Decisions, and Information Needs...
-
What are three basic methods for allocating factory overhead costs?
Study smarter with the SolutionInn App