Answered step by step
Verified Expert Solution
Question
1 Approved Answer
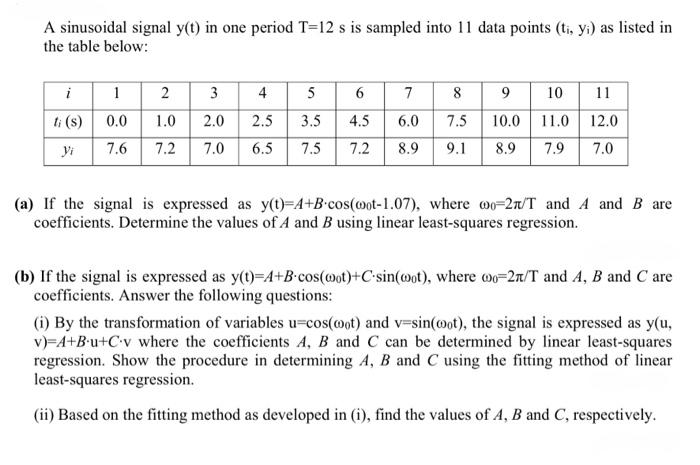
A sinusoidal signal y(t) in one period T=12 s is sampled into 11 data points (ti, yi) as listed in the table below: i 1
Step by Step Solution
There are 3 Steps involved in it
Step: 1

Get Instant Access to Expert-Tailored Solutions
See step-by-step solutions with expert insights and AI powered tools for academic success
Step: 2

Step: 3
Ace Your Homework with AI
Get the answers you need in no time with our AI-driven, step-by-step assistance
Get Started