

Answered step by step
Verified Expert Solution
Question
1 Approved Answer
a) State with brief reasons whether the following statements are True or False. i) ii) iii) If heteroscedasticity is present, the conventional t and
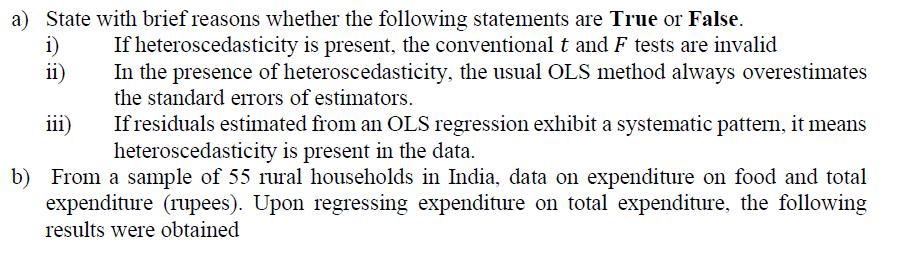
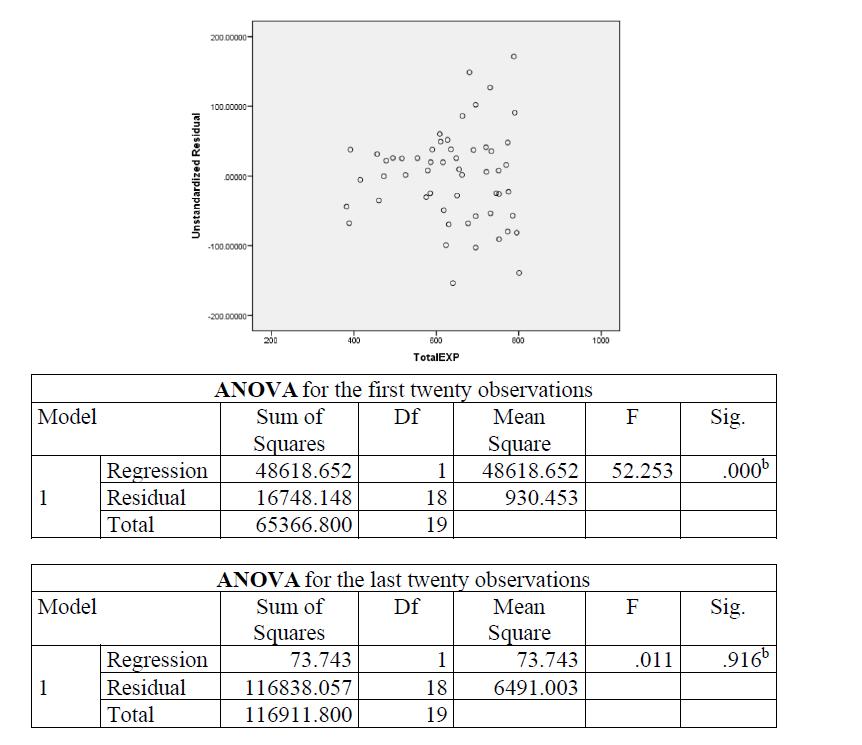
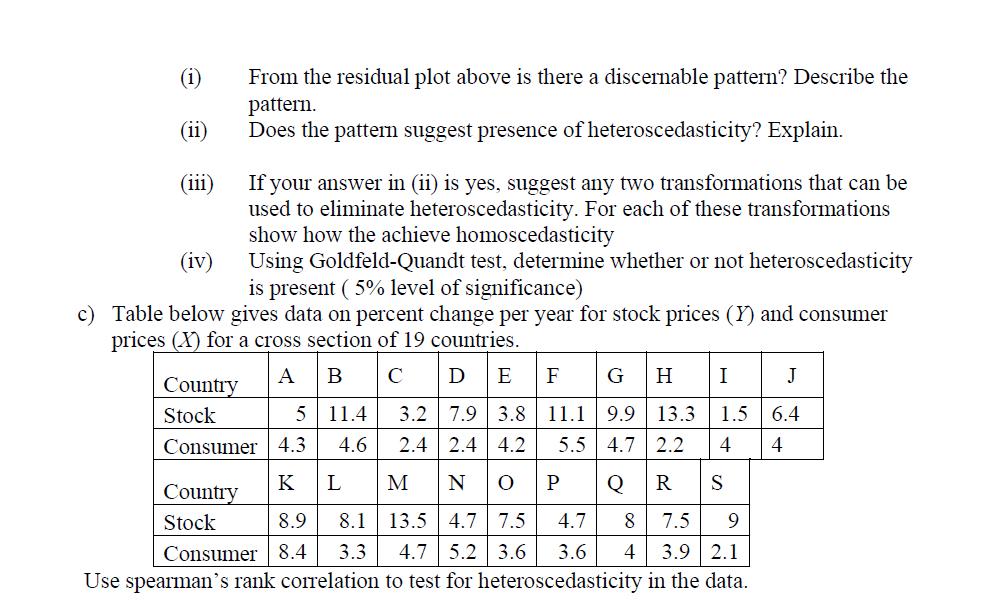
a) State with brief reasons whether the following statements are True or False. i) ii) iii) If heteroscedasticity is present, the conventional t and F tests are invalid In the presence of heteroscedasticity, the usual OLS method always overestimates the standard errors of estimators. If residuals estimated from an OLS regression exhibit a systematic pattern, it means heteroscedasticity is present in the data. b) From a sample of 55 rural households in India, data on expenditure on food and total expenditure (rupees). Upon regressing expenditure on total expenditure, the following results were obtained 200.00000- 100.00000- Unstandardized Residual 00000- -100.00000- -200.00000- o o 0 8 a 0 0 200 400 600 800 1000 TotalEXP ANOVA for the first twenty observations Model Sum of Df Mean F Sig. Squares Square Regression 48618.652 1 48618.652 52.253 .000b 1 Residual Total 16748.148 18 930.453 65366.800 19 ANOVA for the last twenty observations Model Sum of Df Mean F Sig. Squares Square Regression 73.743 1 73.743 .011 .916b 1 Residual 116838.057 18 6491.003 Total 116911.800 19 (11) (111) (iv) From the residual plot above is there a discernable pattern? Describe the pattern. Does the pattern suggest presence of heteroscedasticity? Explain. If your answer in (ii) is yes, suggest any two transformations that can be used to eliminate heteroscedasticity. For each of these transformations show how the achieve homoscedasticity Using Goldfeld-Quandt test, determine whether or not heteroscedasticity is present (5% level of significance) c) Table below gives data on percent change per year for stock prices (Y) and consumer prices (X) for a cross section of 19 countries. A B C D E F G H I J Country Stock 5 11.4 3.2 7.9 3.8 11.1 9.9 13.3 1.5 6.4 Consumer 4.3 4.6 2.4 2.4 4.2 5.5 4.7 2.2 4 4 Country K L M N P Q R S Stock 8.9 8.1 13.5 4.7 7.5 4.7 Consumer 8.4 3.3 4.7 5.2 3.6 3.6 4 3.9 2.1 Use spearman's rank correlation to test for heteroscedasticity in the data. 76 8 7.5 9
Step by Step Solution
There are 3 Steps involved in it
Step: 1

Get Instant Access to Expert-Tailored Solutions
See step-by-step solutions with expert insights and AI powered tools for academic success
Step: 2

Step: 3
Ace Your Homework with AI
Get the answers you need in no time with our AI-driven, step-by-step assistance
Get Started
Probability & Statistics For Engineers & Scientists
Authors: Ronald E. Walpole, Raymond H. Myers, Sharon L. Myers, Keying
7th Edition
9789813131279, 130415294, 9813131276, 978-0130415295