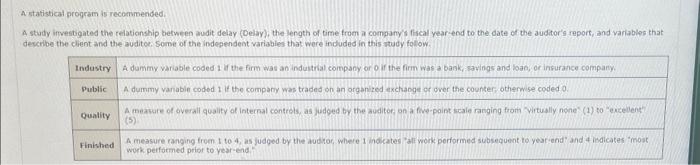
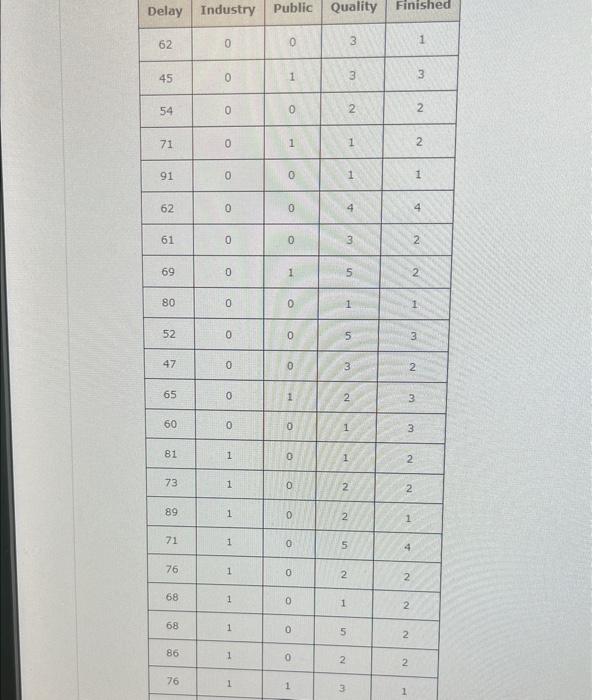
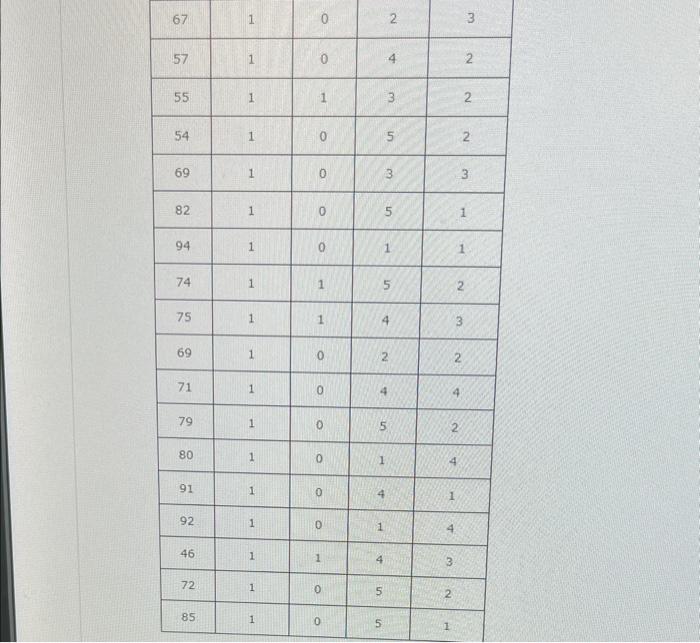
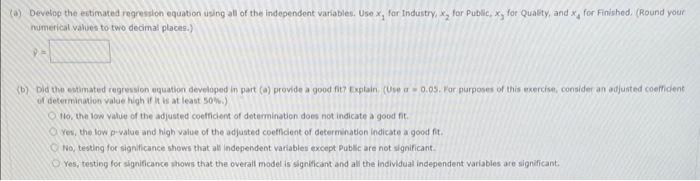
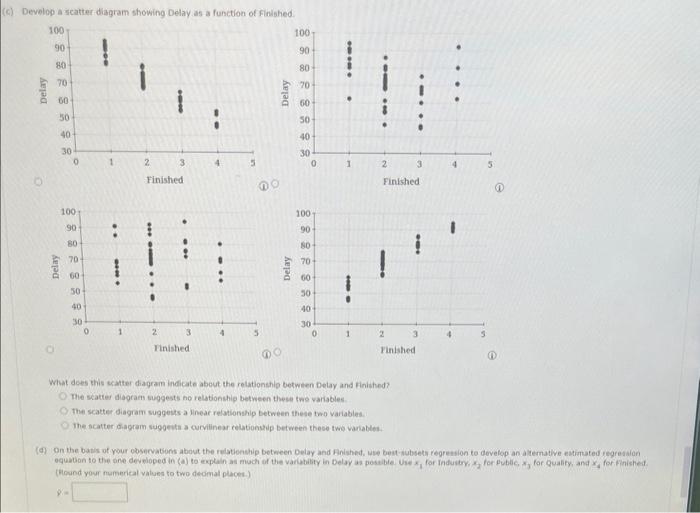
A statistical program is recommended. A study ifvestigated the relationship between audit delay (Delay), the length of time from a company's fiscal year-end to the date of the auditor's report, and variables that dexcribe the client and the auditoc. Somit of the independent variables that were induded in this rtudy follow. (a) Devetop the entimated regrestion equabon using all of the independent variablec. Use x1 for Industry, x2 for Pubilic, x, for Quabty, and x4 for Finished. (Round your mimerical values to two dedimal places.) P= (b) Did the estlmated regression equation developed in part (a) provide a good fit? Exptain (Uwe a =0.09. For purposes of this exercisel, consider an adjunted coeficient of determination value high if it is at least 50m.) 11o. the row value of the adjusted coefficient of determination does not indicate a good fit. Yes, the low p.value and high value of the adjusted coeffilent of determination indicate a good fit. No, testing for significance shows that all independent variables except Public are not significant. Yes, testing for significance thows that the overall model is signiticant and all the individual independent variables are significant. C) Develop a scatter diagram showing Delay as a function of Finished. What does this ccatter diagram indicate about the resationship between belay and finititied? the statter diogram wiggests ho relationship between these tro variables. The scatter diagrain suggeuts a linear relationehip between these too variables. The acatter diagram suggent a corvilinear folationulip between these two variables. (Hlosind your numerical values to two decimal places.) A statistical program is recommended. A study ifvestigated the relationship between audit delay (Delay), the length of time from a company's fiscal year-end to the date of the auditor's report, and variables that dexcribe the client and the auditoc. Somit of the independent variables that were induded in this rtudy follow. (a) Devetop the entimated regrestion equabon using all of the independent variablec. Use x1 for Industry, x2 for Pubilic, x, for Quabty, and x4 for Finished. (Round your mimerical values to two dedimal places.) P= (b) Did the estlmated regression equation developed in part (a) provide a good fit? Exptain (Uwe a =0.09. For purposes of this exercisel, consider an adjunted coeficient of determination value high if it is at least 50m.) 11o. the row value of the adjusted coefficient of determination does not indicate a good fit. Yes, the low p.value and high value of the adjusted coeffilent of determination indicate a good fit. No, testing for significance shows that all independent variables except Public are not significant. Yes, testing for significance thows that the overall model is signiticant and all the individual independent variables are significant. C) Develop a scatter diagram showing Delay as a function of Finished. What does this ccatter diagram indicate about the resationship between belay and finititied? the statter diogram wiggests ho relationship between these tro variables. The scatter diagrain suggeuts a linear relationehip between these too variables. The acatter diagram suggent a corvilinear folationulip between these two variables. (Hlosind your numerical values to two decimal places.)