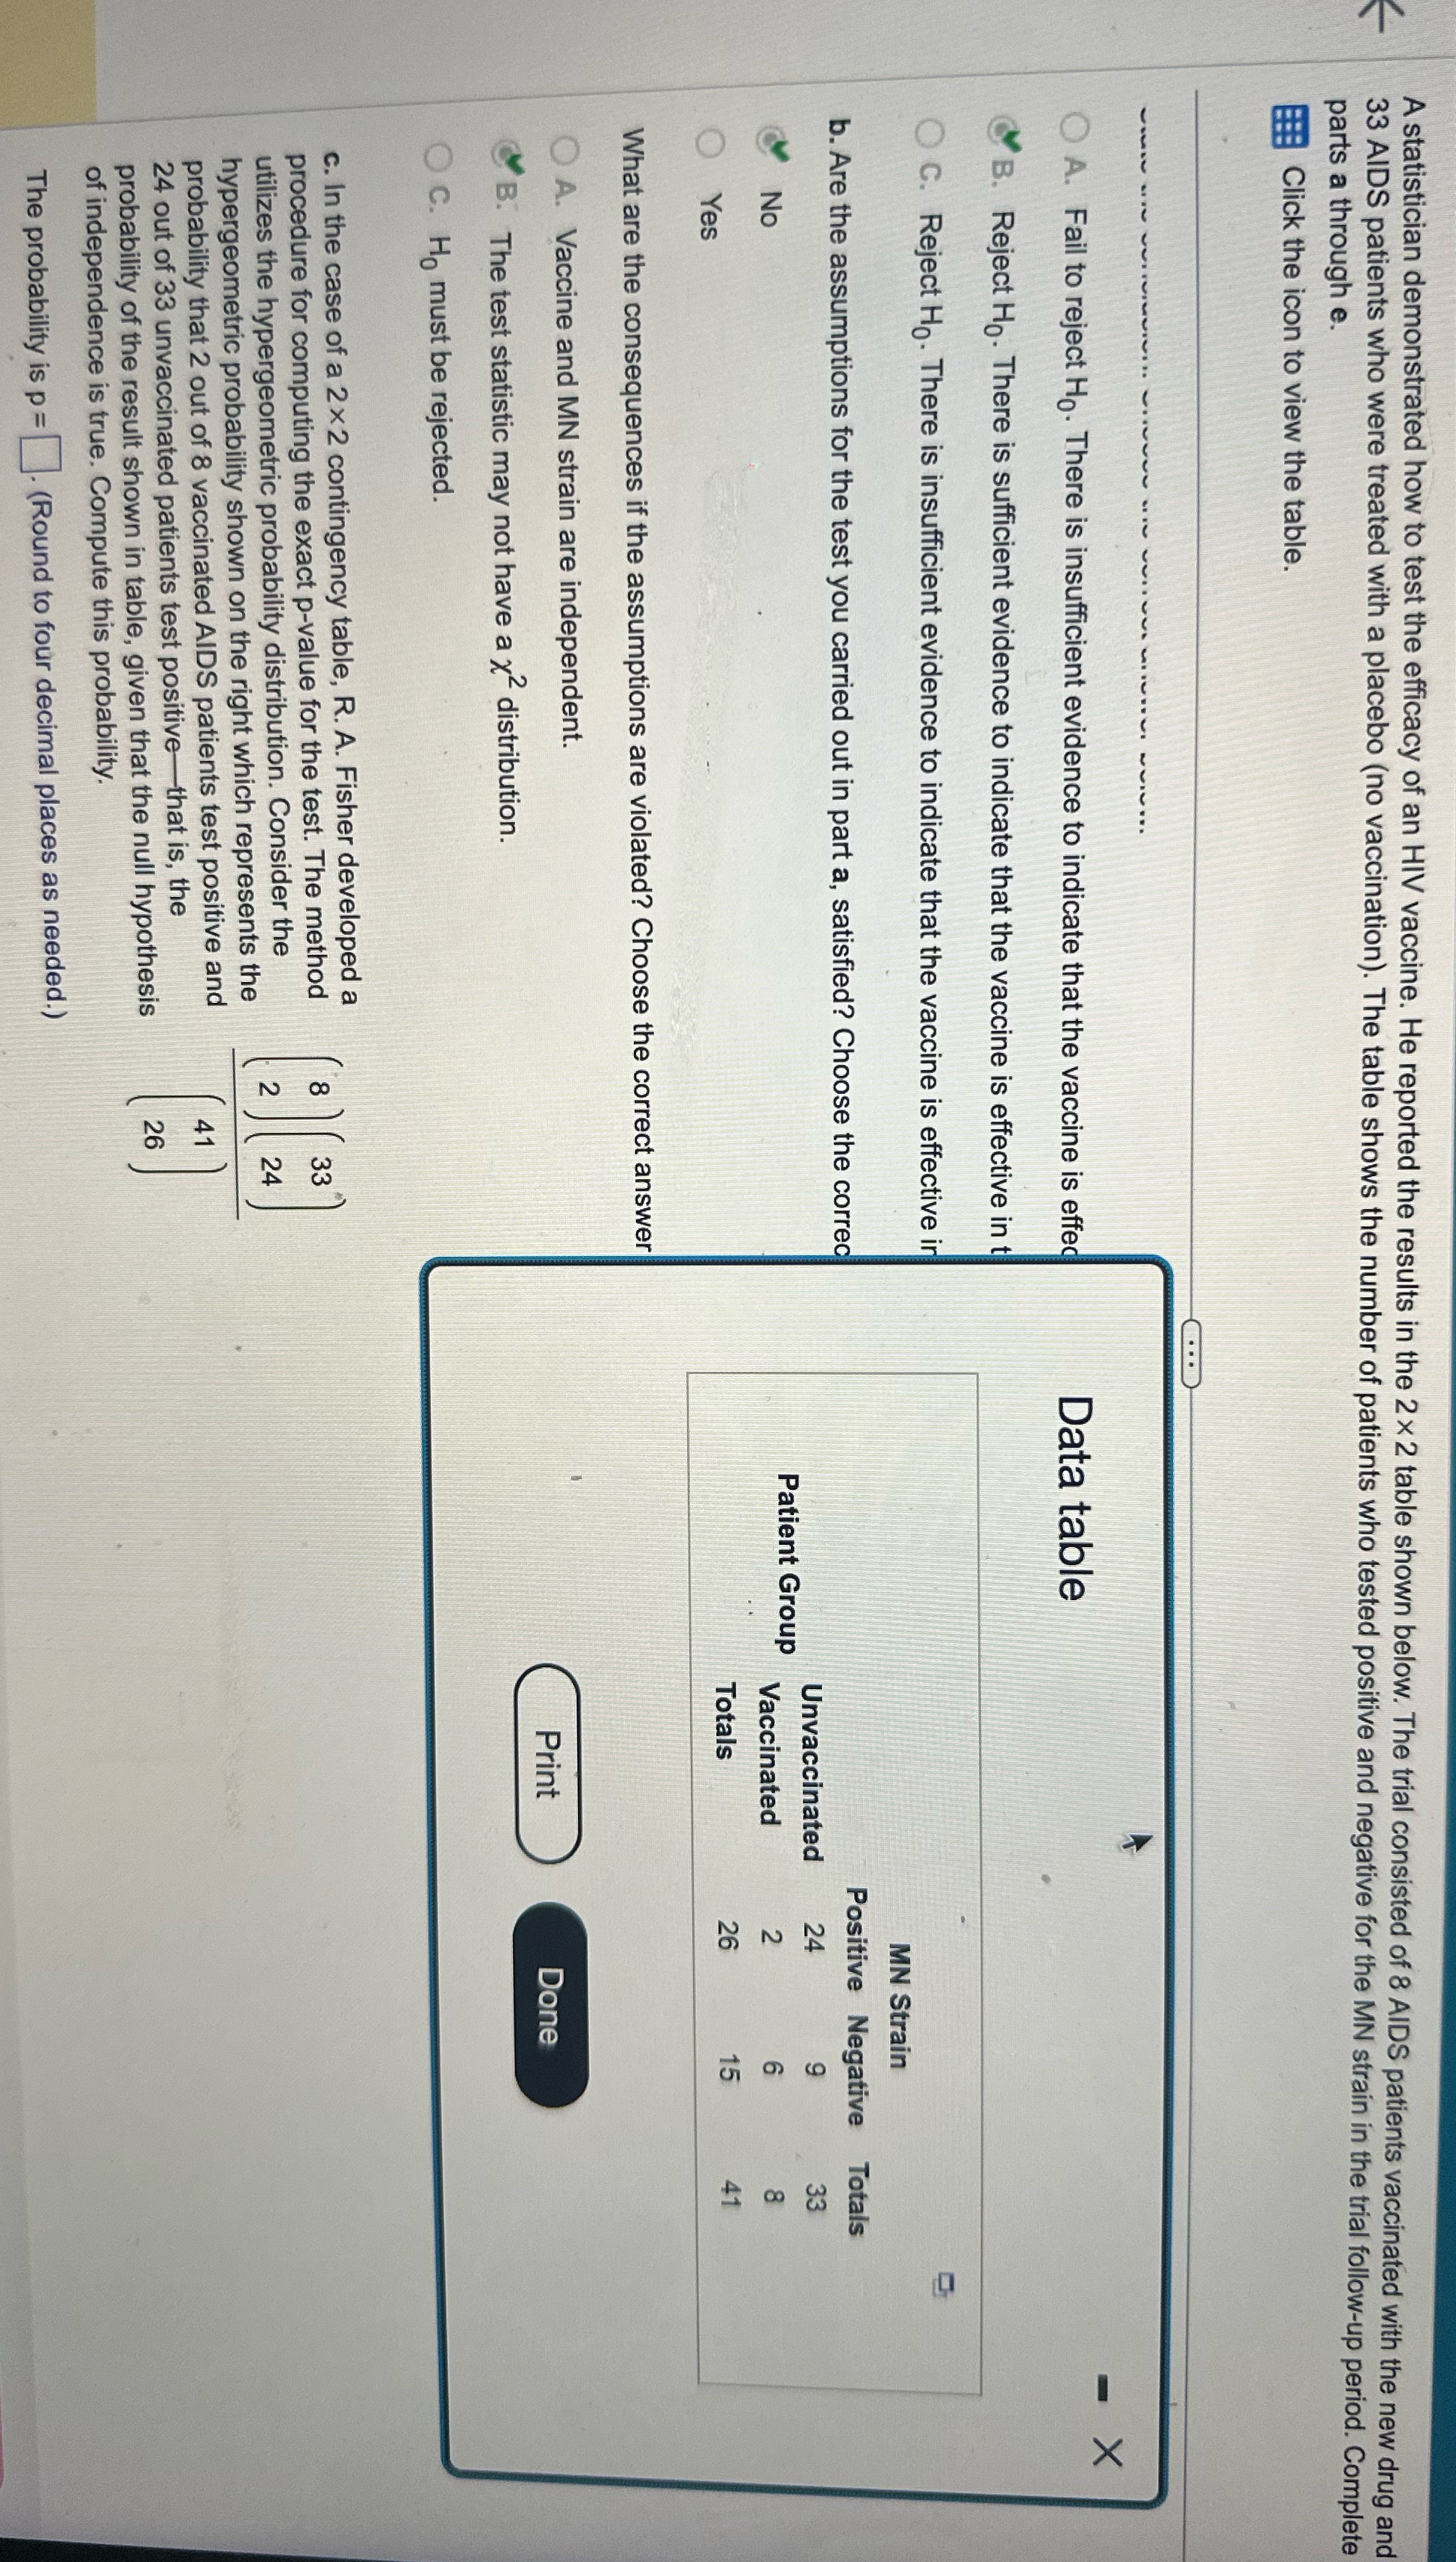
A statistician demonstrated how to test the efficacy of an HIV vaccine. He reported the results in the 2 x 2 table shown below. The trial consisted of 8 AIDS patients vaccinated with the new drug and 33 AIDS patients who were treated with a placebo (no vaccination). The table shows the number of patients who tested positive and negative for the MN strain in the trial follow-up period. Complete parts a through e. Click the icon to view the table. X O A. Fail to reject Ho. There is insufficient evidence to indicate that the vaccine is effed Data table B. Reject Ho. There is sufficient evidence to indicate that the vaccine is effective in t O C. Reject Ho. There is insufficient evidence to indicate that the vaccine is effective in MN Strain b. Are the assumptions for the test you carried out in part a, satisfied? Choose the corred Positive Negative Totals Unvaccinated No Patient Group Vaccinated O Yes Totals What are the consequences if the assumptions are violated? Choose the correct answer A. Vaccine and MN strain are independent. Print Done B. The test statistic may not have a x2 distribution. O C. Ho must be rejected. c. In the case of a 2 x 2 contingency table, R. A. Fisher developed a procedure for computing the exact p-value for the test. The method 00 utilizes the hypergeometric probability distribution. Consider the 24 hypergeometric probability shown on the right which represents the probability that 2 out of 8 vaccinated AIDS patients test positive and 24 out of 33 unvaccinated patients test positive-that is, the probability of the result shown in table, given that the null hypothesis of independence is true. Compute this probability. The probability is p = . (Round to four decimal places as needed.)