Answered step by step
Verified Expert Solution
Link Copied!

Question

1 Approved Answer

A steel pipe company recently developed a new pipe product for a customer. According to?specifications, the pipe is supposed to have an average outside diameter

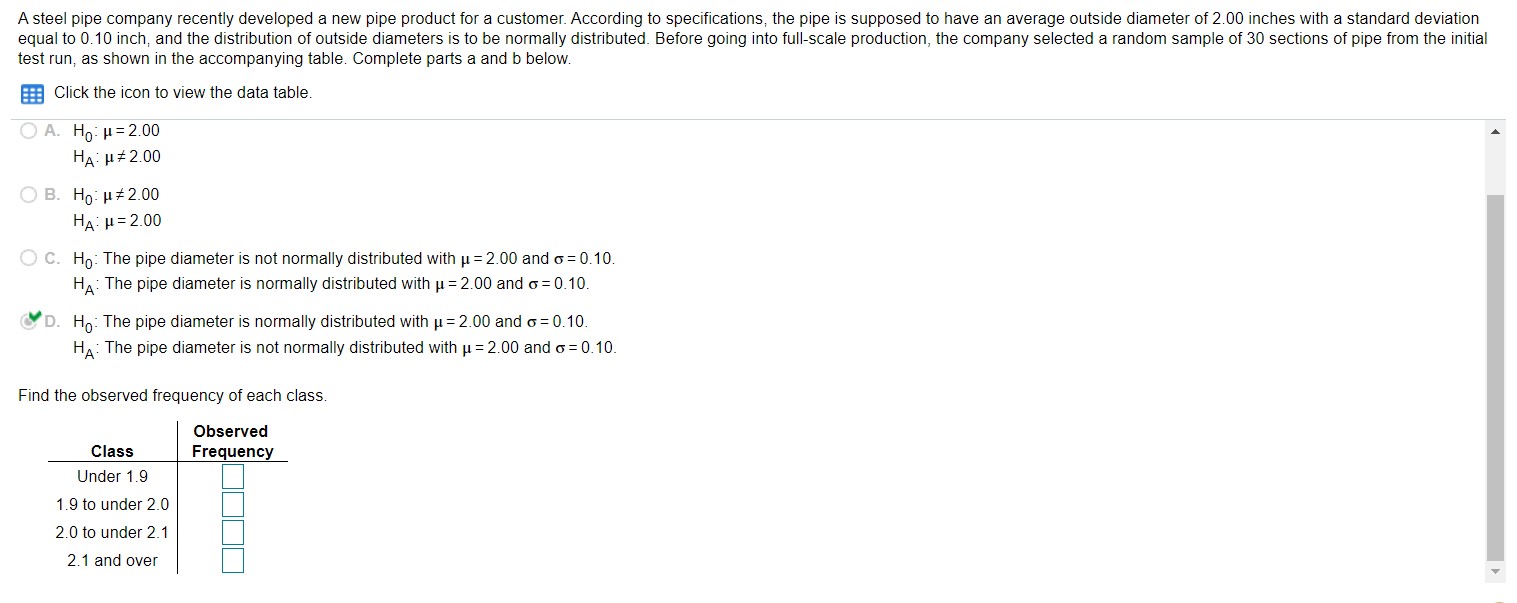
A steel pipe company recently developed a new pipe product for a customer. According to?specifications, the pipe is supposed to have an average outside diameter of 2.00 inches with a standard deviation equal to 0.10?inch, and the distribution of outside diameters is to be normally distributed. Before going into?full-scale production, the company selected a random sample of 30 sections of pipe from the initial test?run, as shown in the accompanying table. Complete the following parts below.

(Use Chi-square Goodness-of-Fit Test)
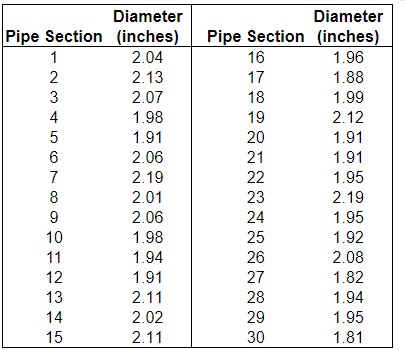
image text in transcribedimage text in transcribed
Diameter Diameter Pipe Section (inches) Pipe Section (inches) 2.04 16 1.96 2.13 17 1.88 2.07 18 1.99 1.98 19 2.12 1.91 20 1.91 2.06 21 1.91 2.19 22 1.95 2.01 23 2.19 2.06 24 1.95 1.98 25 1.92 1.94 26 2.08 12 1.91 27 1.82 13 2.11 28 1.94 14 2.02 29 1.95 15 2.11 30 1.81A steel pipe company recently developed a new pipe product for a customer. According to specifications, the pipe is supposed to have an average outside diameter of 2.00 inches with a standard deviation equal to 0.10 inch, and the distribution of outside diameters is to be normally distributed. Before going into full-scale production, the company selected a random sample of 30 sections of pipe from the initial test run, as shown in the accompanying table. Complete parts a and b below. Click the icon to view the data table. O A. Ho: H= 2.00 HA: H # 2.00 O B. Ho: H # 2.00 HA: H = 2.00 O C. Ho: The pipe diameter is not normally distributed with u = 2.00 and o = 0.10. HA: The pipe diameter is normally distributed with u = 2.00 and o = 0.10. D. Ho: The pipe diameter is normally distributed with u = 2.00 and o = 0.10. HA: The pipe diameter is not normally distributed with u = 2.00 and o = 0. 10. Find the observed frequency of each class. Observed Class Frequency Under 1.9 1.9 to under 2.0 2.0 to under 2.1 2.1 and over

Step by Step Solution

There are 3 Steps involved in it

Step: 1

blur-text-image

Get Instant Access to Expert-Tailored Solutions

See step-by-step solutions with expert insights and AI powered tools for academic success

Step: 2

blur-text-image

Step: 3

blur-text-image

Ace Your Homework with AI

Get the answers you need in no time with our AI-driven, step-by-step assistance

Get Started

Recommended Textbook for

Algebra And Trigonometry, Enhanced

Authors: Cynthia Y Young

4th Edition

1119320860, 9781119320869

More Books

Students also viewed these Mathematics questions

Question

Define Decision making

Answered: 1 week ago

Question

What are the major social responsibilities of business managers ?

Answered: 1 week ago

Question

What are the skills of management ?

Answered: 1 week ago