Answered step by step
Verified Expert Solution
Question
1 Approved Answer
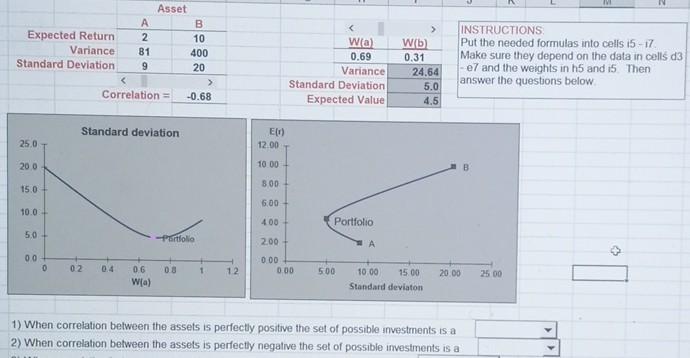
A straight line b curve c kinked me please explain CN Asset B Expected Return 10 Variance 81 400 Standard Deviation 9 20 > Correlation

A straight line b curve c kinked me
please explain
CN Asset B Expected Return 10 Variance 81 400 Standard Deviation 9 20 > Correlation = -0.68 Wia 0.69 Variance Standard Deviation Expected Value W(b) 0.31 24.64 5.0 4.5 INSTRUCTIONS Put the needed formulas into cells i5 - 17 Make sure they depend on the data in cells d3 - e7 and the weights in h5 and 15 Then answer the questions below Standard deviation El 12.00 250 200 10.00 B 800 15.0 6.00 10.0 400 Portfolio 50 - sctfolio 2.00 > 00 0 02 08 1 12 0.00 000 0.6 Wia) 500 20.00 25 00 10.00 15.00 Standard deviaton 1) When correlation between the assets is perfectly positive the set of possible investments is a 2) When correlation between the assets is perfectly negative the set of possible investments is a CN Asset B Expected Return 10 Variance 81 400 Standard Deviation 9 20 > Correlation = -0.68 Wia 0.69 Variance Standard Deviation Expected Value W(b) 0.31 24.64 5.0 4.5 INSTRUCTIONS Put the needed formulas into cells i5 - 17 Make sure they depend on the data in cells d3 - e7 and the weights in h5 and 15 Then answer the questions below Standard deviation El 12.00 250 200 10.00 B 800 15.0 6.00 10.0 400 Portfolio 50 - sctfolio 2.00 > 00 0 02 08 1 12 0.00 000 0.6 Wia) 500 20.00 25 00 10.00 15.00 Standard deviaton 1) When correlation between the assets is perfectly positive the set of possible investments is a 2) When correlation between the assets is perfectly negative the set of possible investments is aStep by Step Solution
There are 3 Steps involved in it
Step: 1

Get Instant Access to Expert-Tailored Solutions
See step-by-step solutions with expert insights and AI powered tools for academic success
Step: 2

Step: 3

Ace Your Homework with AI
Get the answers you need in no time with our AI-driven, step-by-step assistance
Get Started


