Question
A strategic group consists of those industry members with similar competitive approaches and positions in the market. Companies in the same strategic group can resemble
A strategic group consists of those industry members with similar competitive approaches and positions in the market. Companies in the same strategic group can resemble one another in a variety of ways. They may have comparable product-line breadth, sell in the same price/quality range, employ the same distribution channels, depend on identical technological approaches, compete in much the same geographic areas, or offer buyers essentially the same product attributes or similar services and technical assistance. Evaluating strategy options entails examining what strategic groups exist, identifying the companies within each group, and determining if a competitive white space exists where industry competitors are able to create and capture altogether new demand. As part of this process, the number of strategic groups in an industry and their respective market positions can be displayed on a strategic group map.
Strategic group mapping is a technique for displaying the different market or competitive positions that rival firms occupy in the industry.
A strategic group is a cluster of industry rivals that have similar competitive approaches and market positions.
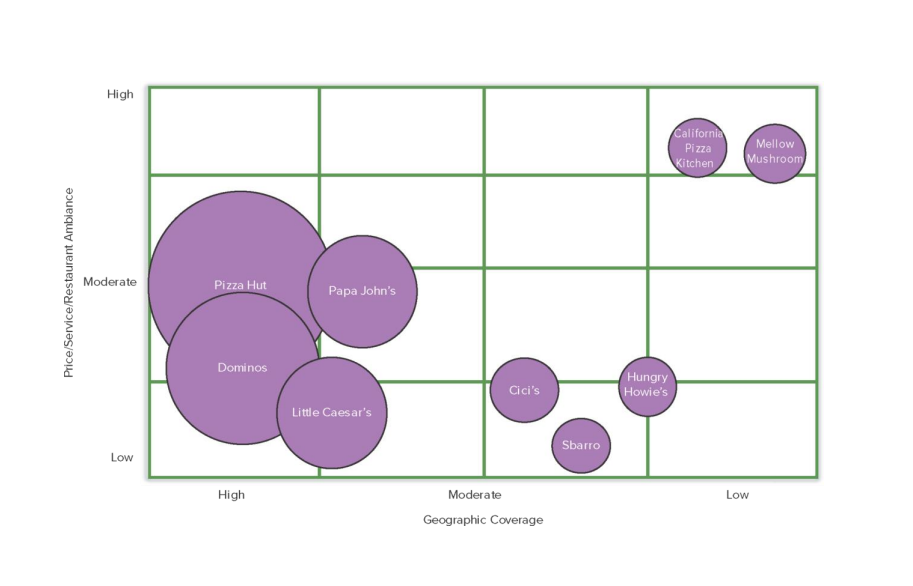
The procedure for constructing a strategic group map is straightforward: Identify the competitive characteristics that delineate strategic approaches used in the industry. Typical variables used in creating strategic group maps are price/quality range (high, medium, low), geographic coverage (local, regional, national, global), product-line breadth (wide, narrow), degree of service offered (no frills, limited, full), use of distribution channels (retail, wholesale, Internet, multiple), degree of vertical integration (none, partial, full), and degree of diversification into other industries (none, some, considerable). Plot the firms on a two-variable map using pairs of these variables. Assign firms occupying about the same map location to the same strategic group. Draw circles around each strategic group, making the circles proportional to the size of the groups share of total industry sales revenues.
This produces a two-dimensional diagram like the one for the U.S. pizza chain industry in the diagram below.
Based on the strategic group map below, which pizza chains are Hungry Howies closest competitors?
With which strategic group does California Pizza Kitchen compete the least, according to this map?
Why do you think no Pizza chains are positioned in the area above the Pizza Huts strategic group? (The map is attached as a pdf file as well if the map is not showing correctly)

Step by Step Solution
There are 3 Steps involved in it
Step: 1

Get Instant Access to Expert-Tailored Solutions
See step-by-step solutions with expert insights and AI powered tools for academic success
Step: 2

Step: 3

Ace Your Homework with AI
Get the answers you need in no time with our AI-driven, step-by-step assistance
Get Started


