A study is done to determine if students in the California state university system take longer to graduate, on average, than students enrolled in private
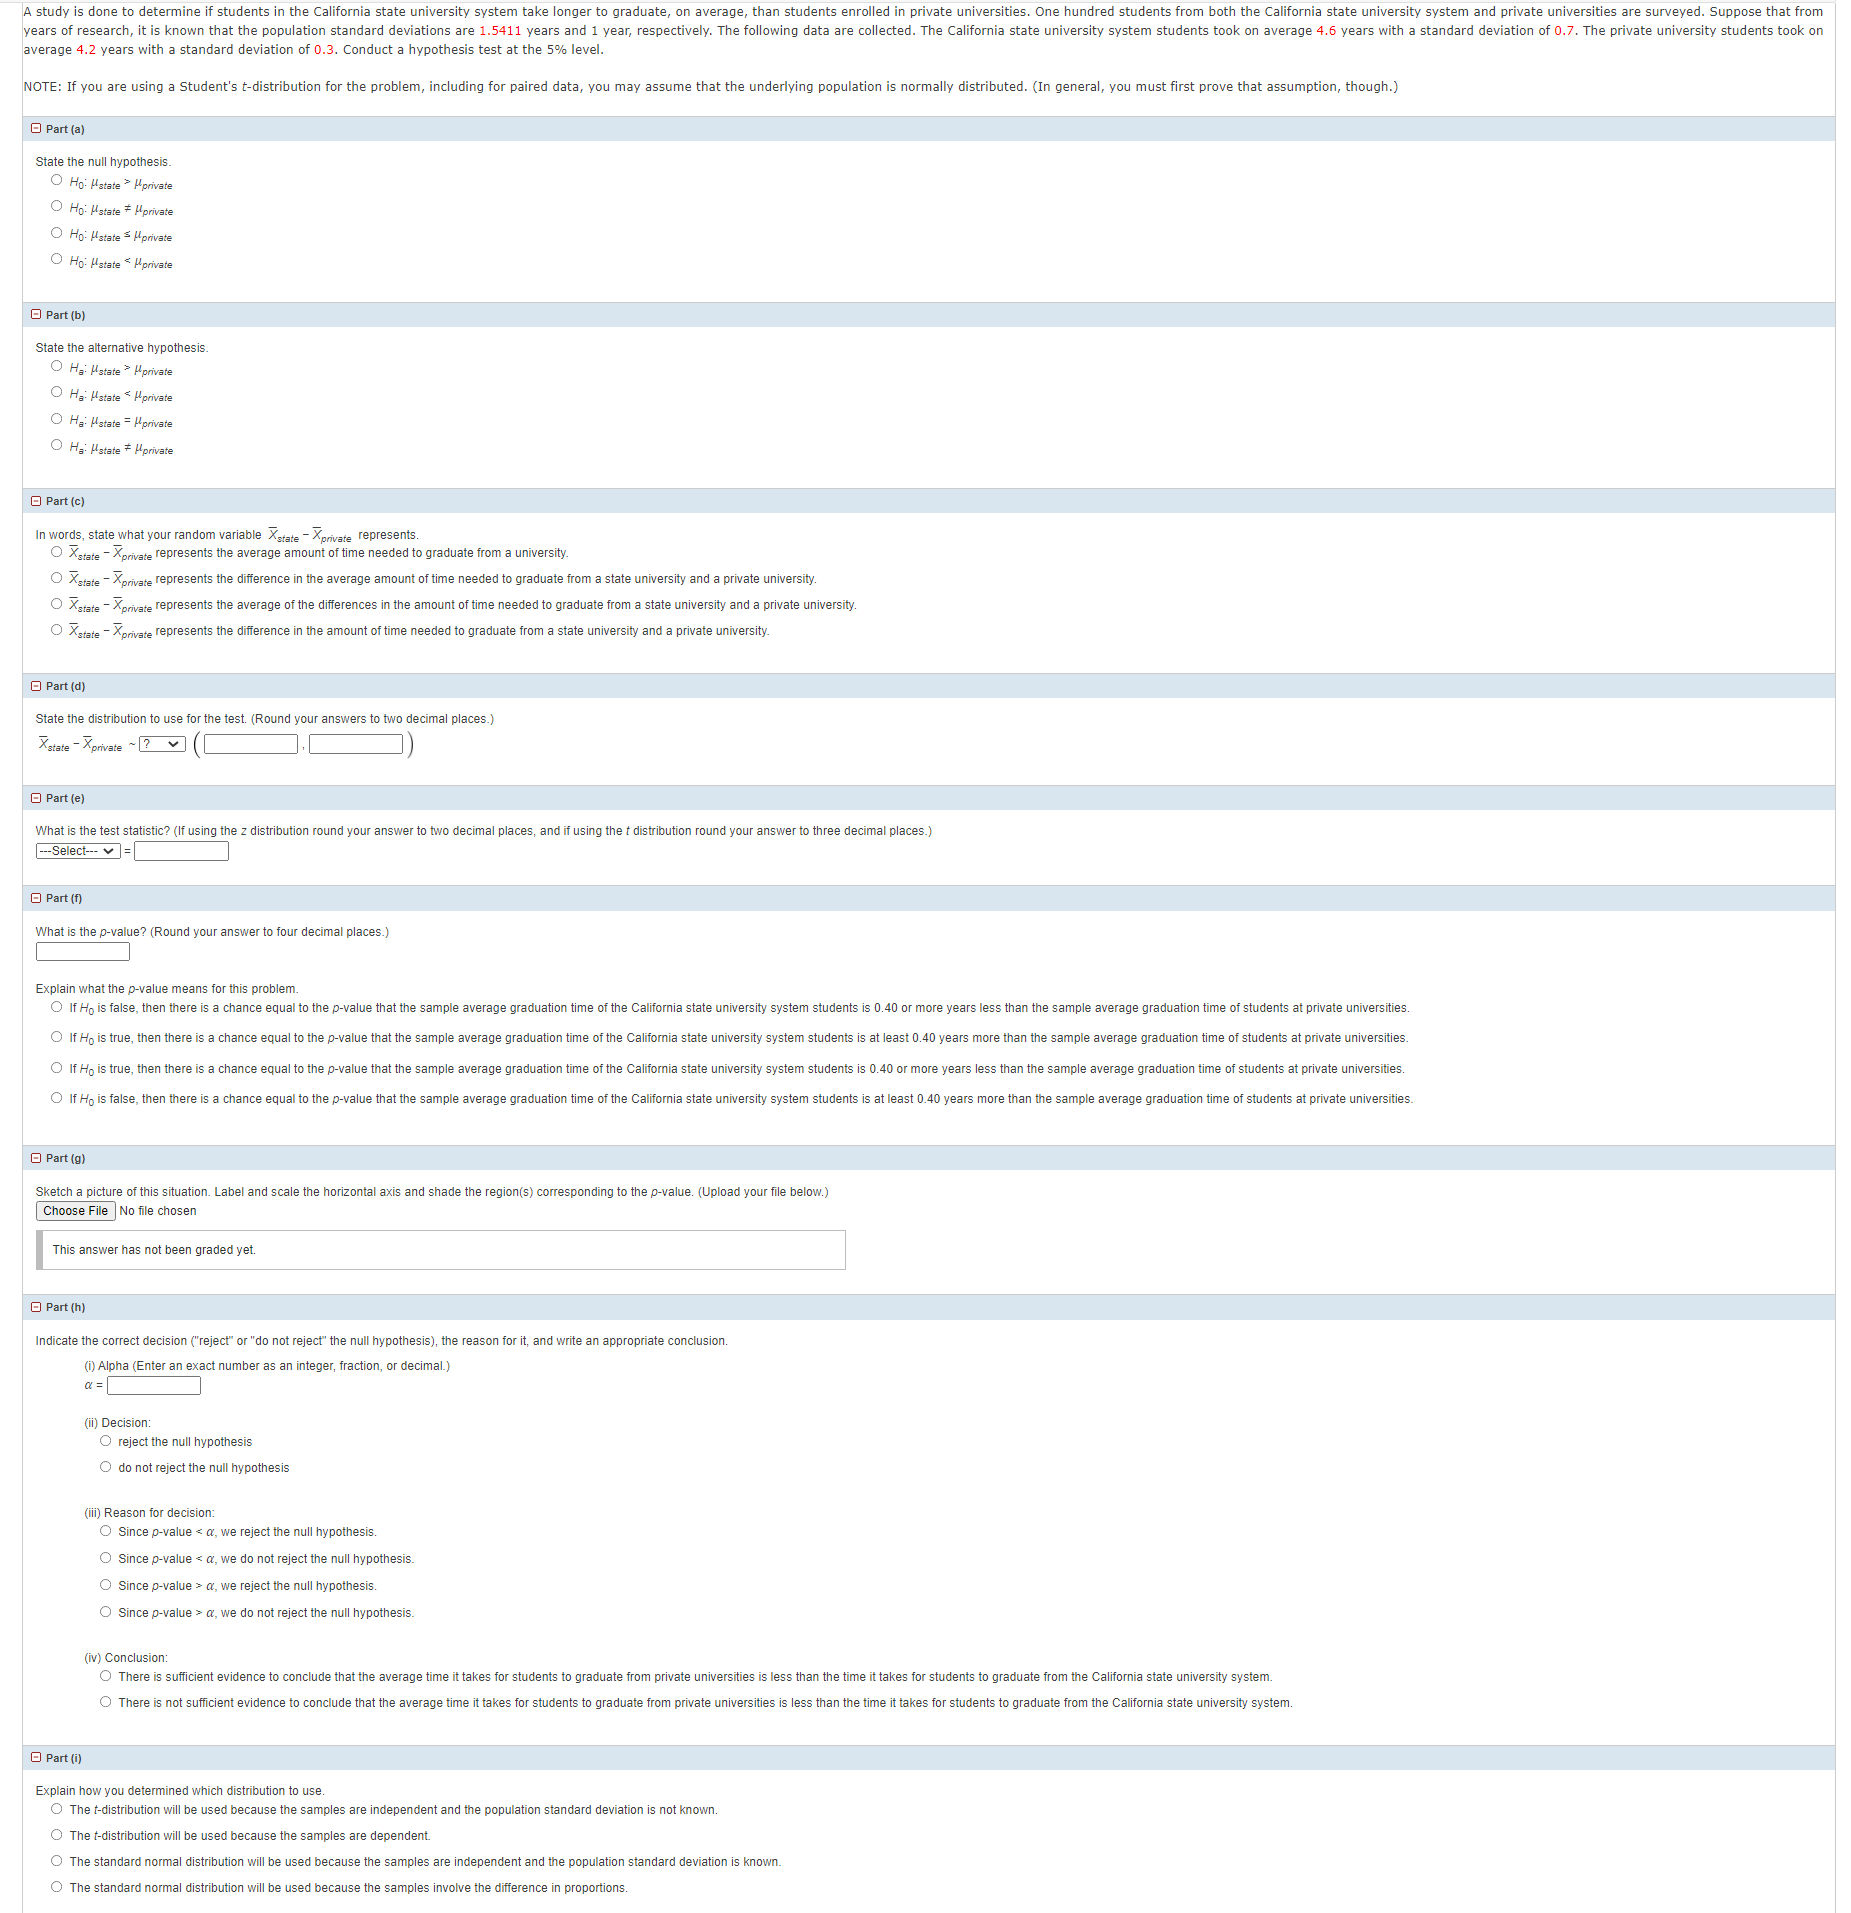
A study is done to determine if students in the California state university system take longer to graduate, on average, than students enrolled in private universities. One hundred students from both the California state university system and private universities are surveyed. Suppose that from years of research, it is known that the population standard deviations a 1.5411 years and 1 year, respectively. The following data are collected. The California state university system students took on average 4.6 years with a standard deviation of 0.7. The private university students took on average 4.2 years with a standard deviation of 0.3. Conduct a hypothesis test at the 5% level. NOTE: If you are using a Student's t-distribution for the problem, including for paired data, you may assume that the underlying population is normally distributed. (In general, you must first prove that assumption, though.) Part ( a ) State the null hypothesis . O Ho: Mstate * Mprivate O Ho: Mstate * Mprivate O Ho: Hstate O Ho: Hstate = Mprivate Part (b) State the alternative hypothesis . O Ha Hatate * Mprivate O Ha: Hstate = Hprivat O Hs: Hstate = Mprivate O Ha: Hstate # Hprivate Part ( c ) In words , state what your random variable *state - Xprivate represents . OXstate - Xprivate represents the average amount of time needed to graduate from a university. O X state - Xprivate represents the difference in the average amount of time needed to graduate from a state university and a private university. O Xstate - Xprivate represents the average of the differences in the amount of time needed to graduate from a state university and a private university. O Xstate - Xprivate represents the difference in the amount of time needed to graduate from a state university and a private university. Part (d) State the distribution to use for the test. (Round your answers to two decimal places . ) Xstate - Xprivate ~ ? Part ( e ) What is the test statistic? (If using the z distribution round your answer to two decimal places, and if using the t distribution round your answer to three decimal places.) --Select--. =[ Part (f) What is the p-value? (Round your answer to four decimal places.) Explain what the p-value means for this problem. O If Ho is false, then there is a chance equal to the p-value that the e of students at private universities. O If Ho is true, then there is a chance ate universities O If Ho is true, then there is a chance f students at private universities. O If Ho is false, then there is a chance equal to the uation time of students at private universities Part (9) Sketch a picture of this situation. Label and scale the horizontal axis and shade the region(s) corresponding to the p-value. (Upload your file below.) Choose File No file chosen This answer has not been graded yet. Part (h) Indicate the correct decision ("reject" or "do not reject" the null hypothesis), the reason for it, and write an appropriate conclusion. (1) Alpha (Enter an exact number as an integer, fraction, or decimal.) a = (ii) Decision: O reject the null hypothesis O do not reject the null hypothesis (ifi) Reason for decision: O Since p-value a, we reject the null hypothesis. O Since p-value > a, we do not reject the null hypothesis. (iv) Conclusion: There is sufficient evidence to conclude that the average time it takes for students to graduate from private universities is less than the time it takes for students to graduate from the California state university system. There is not sufficient evidence to conclude that the average time it takes for students to graduate from private universities is less than the time it takes for students to graduate from the California state university system . Part (i) Explain how you determined which distribution to use. The t-distribution will be used because the samples are independent and the population standard deviation is not known. O The t-distribution will be used because the samples are dependent. The standard normal distribution will les are independent and the population standard deviation is known. The standard normal distribution will be used because the samples involve the difference in proportions
Step by Step Solution
There are 3 Steps involved in it
Step: 1
Get Instant Access to Expert-Tailored Solutions
See step-by-step solutions with expert insights and AI powered tools for academic success
Step: 2
Step: 3
Ace Your Homework with AI
Get the answers you need in no time with our AI-driven, step-by-step assistance