

Question
A study of king penguins looked for a relationship between how deep the penguins dive to seek food and how long they stay underwater. For
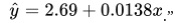
A study of king penguins looked for a relationship between how deep the penguins dive to seek food and how long they stay underwater. For all but the shallowest dives, there is a linear relationship that is different for different penguins. The study gives a scatterplot for one penguin titled "The Relation of Dive Duration (y) to Depth (x)." Duration y is measured in minutes and depth x is in meters. The report then says, "The regression equation for this bird is (**the equation is in the image**)." a) What is the slope of the regression line? Interpret this value.b) Does the y-intercept of the regression line make any sense? If so, interpret it. If not, explain why not.c) According to the regression line, how long does a typical dive to a depth of 200 meters last?d) Suppose that the researchers reversed the variables, using x = dive duration and y = depth. What effect will this have on the correlation? On the equation of the least-squares regression line?
Step by Step Solution
There are 3 Steps involved in it
Step: 1

Get Instant Access to Expert-Tailored Solutions
See step-by-step solutions with expert insights and AI powered tools for academic success
Step: 2

Step: 3
Ace Your Homework with AI
Get the answers you need in no time with our AI-driven, step-by-step assistance
Get Started
Advanced Engineering Mathematics
Authors: ERWIN KREYSZIG
9th Edition
0471488852, 978-0471488859