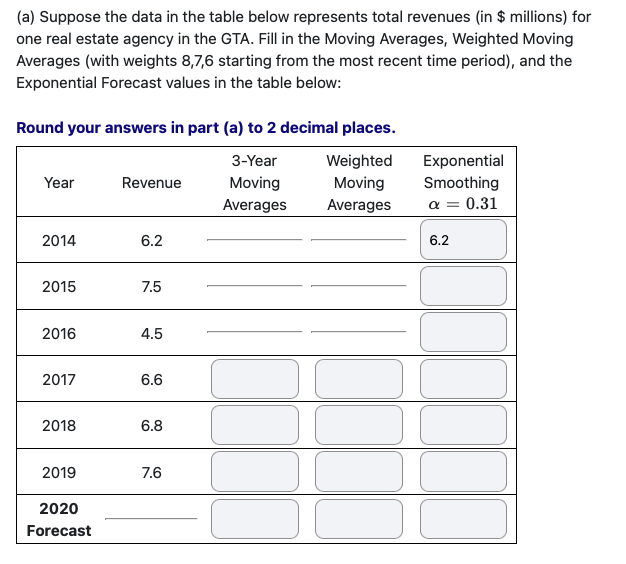
(a) Suppose the data in the table below represents total revenues (in $ millions) for one real estate agency in the GTA. Fill in the Moving Averages, Weighted Moving Averages (with weights 8,7,6 starting from the most recent time period), and the Exponential Forecast values in the table below: Round your answers in part (a) to 2 decimal places. 3-Year Weighted Exponential Year Revenue Moving Moving Smoothing Averages Averages O = 0.31 2014 6.2 6.2 2015 7.5 2016 4.5 2017 6.6 2018 6.8 2019 7.6 2020 ForecastRound your answers in part (b) to 2 decimal places, and round the MAD/MAE to 3 decimal places. (b) Calculate the MAD (mean absolute deviation), also known as the MAE (mean absolute error), for 3-year moving averages for 2017-2019 (use results from the previous problem). 3-Year Absolute Year Revenue Moving Error Averages 2014 6.2 2015 7.5 2016 4.5 2017 6.6 2018 6.8 2019 7.6 MAD/MAERound your answers in part (c) to 2 decimal places, and round the MAD/MAE to 3 decimal places. (c) Calculate the MAD (mean absolute deviation), also known as the MAE (mean absolute error), for weighted moving averages for 2017-2019 (use results from the previous problem with weights 4,2,1 starting from the most recent time period). Weighted Absolute Year Revenue Moving Error Averages 2014 6.2 2015 7.5 2016 4.5 2017 6.6 2018 6.8 2019 7.6 MAD/MAE E (d) Which method provides a better forecast of the revenue for 2017-2019? Round MAD/MAE to three decimal places. o Weighted Moving Averages, since the MAD/MAE for Weighted Moving Averages is greater than the MAD/MAE for 3-Year Moving Averages. 0 3-Year Moving Averages, since the MAD/MAE for 3-Year Moving Averages is greater than the MAD/MAE for Weighted Moving Averages. Weighted Moving Averages, since the MAD/MAE for Weighted Moving Averages is less than the MAD/MAE for 3-Year Moving Averages. 3-Year Moving Averages, since the MAD/MAE for 3-Year Moving Averages is less than the MAD/MAE for Weighted Moving Averages. O None of the above