A. Suppose the goal of the firm is to now provide superior customer service by having the sales consultant identify and sell to the specific needs of the customer. What does this goal suggest about a change in managerial accounting and control systems?
B. What is the additional dollar amount of inventory that must be held? Show all calculations to determine the additional inventory required.
C. Using the information on sales and expenses for a typical store, provide an analysis of the additional store profit contributed by the plan. Assume that it costs 12% a year to carry the added inventory. Show all calculations. Look at data before and data after then calculate delta.
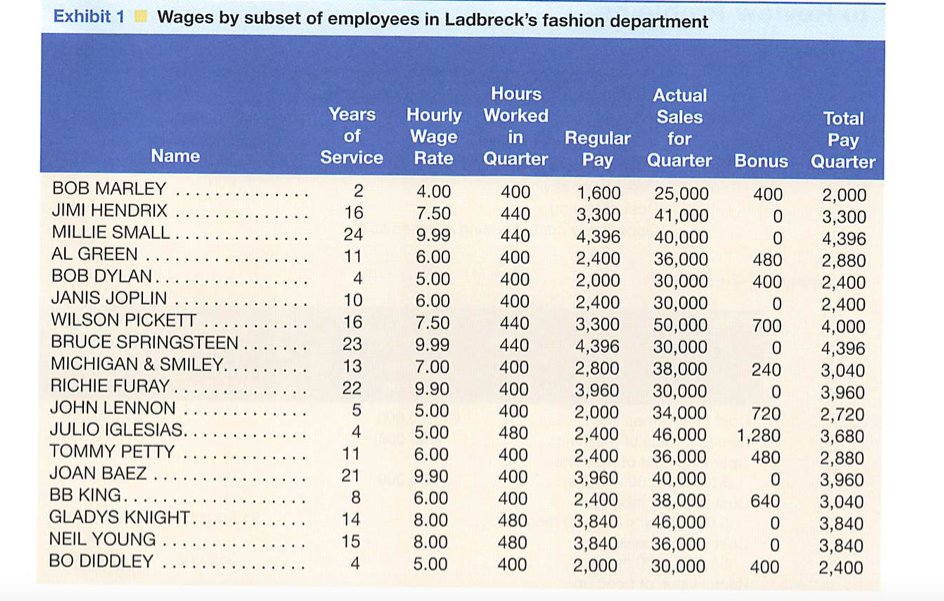
D. Look at Exhibit 1, which provides a partial listing of employee pay for one small department within a store. Which type of employee is receiving the bonus?
E. Should the company keep the plan? Explain your estimate of the financial impact of the plan and also incorporate any nonfinancial information you feel is relevant in justifying your decision. provide all arguments to the position. I believe that it is best to keep the plan but I want to know why and why would someone want to remove it.
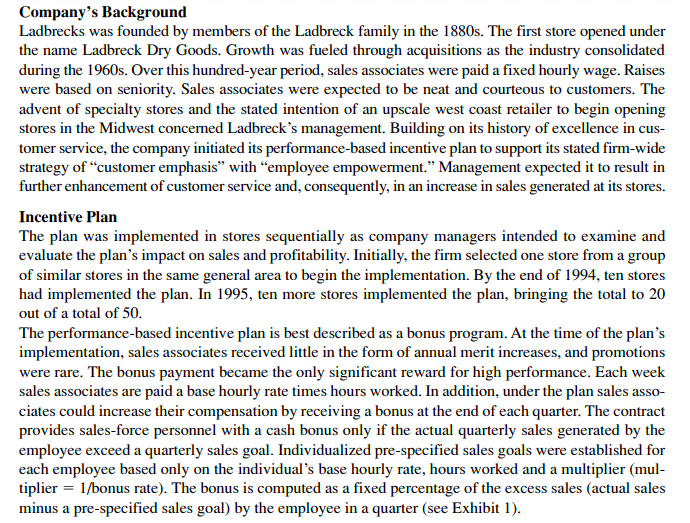
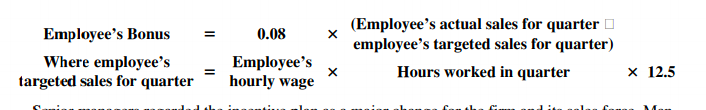
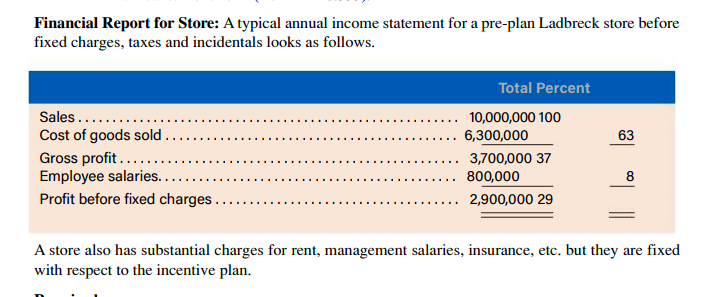
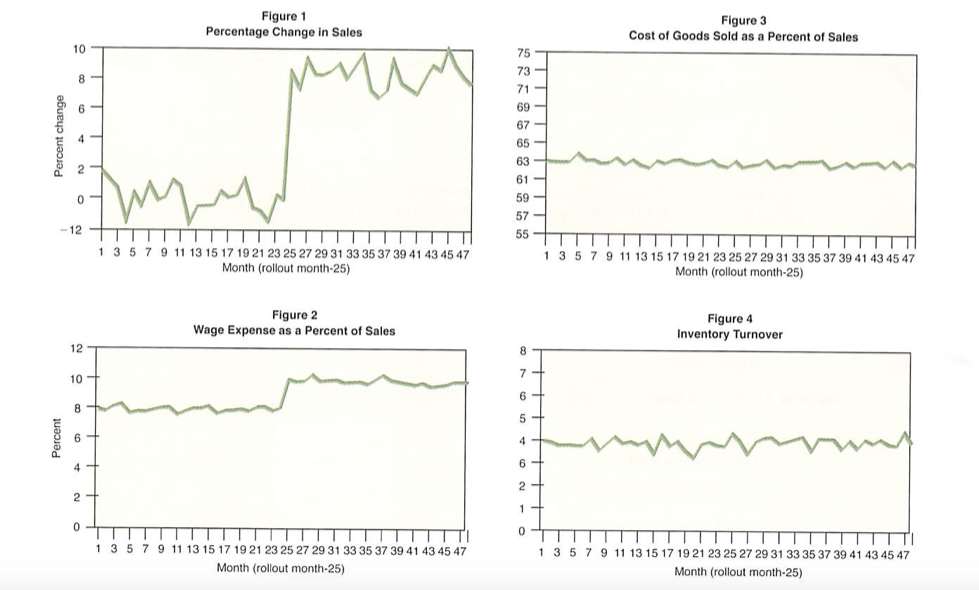
Company's Background Ladbrecks was founded by members of the Ladbreck family in the 1880s. The first store opened under the name Ladbreck Dry Goods. Growth was fueled through acquisitions as the industry consolidated during the 1960s. Over this hundred-year period, sales associates were paid a fixed hourly wage. Raises were based on seniority. Sales associates were expected to be neat and courteous to customers. The advent of specialty stores and the stated intention of an upscale west coast retailer to begin opening stores in the Midwest concerned Ladbreck's management. Building on its history of excellence in cus- tomer service, the company initiated its performance-based incentive plan to support its stated firm-wide strategy of customer emphasis" with "employee empowerment." Management expected it to result in further enhancement of customer service and, consequently, in an increase in sales generated at its stores. Incentive Plan The plan was implemented in stores sequentially as company managers intended to examine and evaluate the plan's impact on sales and profitability. Initially, the firm selected one store from a group of similar stores in the same general area to begin the implementation. By the end of 1994, ten stores had implemented the plan. In 1995, ten more stores implemented the plan, bringing the total to 20 out of a total of 50. The performance-based incentive plan is best described as a bonus program. At the time of the plan's implementation, sales associates received little in the form of annual merit increases, and promotions were rare. The bonus payment became the only significant reward for high performance. Each week sales associates are paid a base hourly rate times hours worked. In addition, under the plan sales asso- ciates could increase their compensation by receiving a bonus at the end of each quarter. The contract provides sales-force personnel with a cash bonus only if the actual quarterly sales generated by the employee exceed a quarterly sales goal. Individualized pre-specified sales goals were established for each employee based only on the individual's base hourly rate, hours worked and a multiplier (mul- tiplier = 1/bonus rate). The bonus is computed as a fixed percentage of the excess sales (actual sales minus a pre-specified sales goal) by the employee in a quarter (see Exhibit 1). = x Employee's Bonus Where employee's targeted sales for quarter 0.08 Employees hourly wage (Employee's actual sales for quarter employee's targeted sales for quarter) Hours worked in quarter X 12.5 s t i.. . . . .. ... . .. Financial Report for Store: A typical annual income statement for a pre-plan Ladbreck store before fixed charges, taxes and incidentals looks as follows. Total Percent Sales .......... Cost of goods sold .......... Gross profit.. Employee salaries........................ Profit before fixed charges .......... .......... 10,000,000 100 ........... 6,300,000 .. 3,700,000 37 ............. 800,000 ............ 2,900,000 29 ............ A store also has substantial charges for rent, management salaries, insurance, etc. but they are fixed with respect to the incentive plan. Exhibit 1 Wages by subset of employees in Ladbreck's fashion department Years of Service Pay Regular Pay Name BOB MARLEY JIMI HENDRIX .... MILLIE SMALL ... AL GREEN ...... BOB DYLAN....... JANIS JOPLIN WILSON PICKETT BRUCE SPRINGSTEEN MICHIGAN & SMILEY.... RICHIE FURAY ........ JOHN LENNON. JULIO IGLESIAS... TOMMY PETTY JOAN BAEZ BB KING....... GLADYS KNIGHT. NEIL YOUNG BO DIDDLEY ...... Hours Hourly Worked Wage in Rate Quarter 4.00 400 7.50 440 9.99 440 6.00 400 5.00 400 6.00 400 7.50 440 9.99 440 7.00 400 9.90 400 5.00 480 6.00 9.90 6.00 400 8.00 480 8.00 5.00 400 1,600 3,300 4,396 2,400 2,000 2,400 3,300 4,396 2,800 3,960 2,000 2,400 2,400 3,960 2,400 3,840 3,840 2,000 Actual Sales Total for Quarter Bonus Quarter 25,000 400 2,000 41,000 3,300 40,000 4,396 36,000 2,880 30,000 2,400 30,000 2,400 50,000 4,000 30,000 4,396 38,000 240 3,040 30,000 3,960 34,000 720 2,720 46,000 1,280 3,680 36,000 480 2,880 40,000 3,960 38,000 3,040 46,000 3,840 36,000 3,840 30,000 2,400 400 5.00 400 400 480 Figure 1 Percentage Change in Sales Figure 3 Cost of Goods Sold as a Percent of Sales Percent change TTTTTTTTT 12 TTTTTTTTTTTTTTTTTTTTTTT 1 3 5 7 9 11 13 15 17 19 21 23 25 27 29 31 33 35 37 39 41 43 45 47 Month (rollout month-25) 55+TTTTTTTTTTTTTTTTTTTTTT 1 3 5 7 9 11 13 15 17 19 21 23 25 27 29 31 33 35 37 39 41 43 45 47 Month (rollout month-25) Figure 2 Wage Expense as a Percent of Sales Figure 4 Inventory Turnover Percent TTTTTTTTTTTTTTTTI 1 3 5 7 9 11 13 15 17 19 21 23 25 27 29 31 33 35 37 39 41 43 45 47 Month (rollout month-25) TTTTTTTTTTTTTTTI 1 3 5 7 9 11 13 15 17 19 21 23 25 27 29 31 33 35 37 39 41 43 45 47 Month (rollout month-25) Company's Background Ladbrecks was founded by members of the Ladbreck family in the 1880s. The first store opened under the name Ladbreck Dry Goods. Growth was fueled through acquisitions as the industry consolidated during the 1960s. Over this hundred-year period, sales associates were paid a fixed hourly wage. Raises were based on seniority. Sales associates were expected to be neat and courteous to customers. The advent of specialty stores and the stated intention of an upscale west coast retailer to begin opening stores in the Midwest concerned Ladbreck's management. Building on its history of excellence in cus- tomer service, the company initiated its performance-based incentive plan to support its stated firm-wide strategy of customer emphasis" with "employee empowerment." Management expected it to result in further enhancement of customer service and, consequently, in an increase in sales generated at its stores. Incentive Plan The plan was implemented in stores sequentially as company managers intended to examine and evaluate the plan's impact on sales and profitability. Initially, the firm selected one store from a group of similar stores in the same general area to begin the implementation. By the end of 1994, ten stores had implemented the plan. In 1995, ten more stores implemented the plan, bringing the total to 20 out of a total of 50. The performance-based incentive plan is best described as a bonus program. At the time of the plan's implementation, sales associates received little in the form of annual merit increases, and promotions were rare. The bonus payment became the only significant reward for high performance. Each week sales associates are paid a base hourly rate times hours worked. In addition, under the plan sales asso- ciates could increase their compensation by receiving a bonus at the end of each quarter. The contract provides sales-force personnel with a cash bonus only if the actual quarterly sales generated by the employee exceed a quarterly sales goal. Individualized pre-specified sales goals were established for each employee based only on the individual's base hourly rate, hours worked and a multiplier (mul- tiplier = 1/bonus rate). The bonus is computed as a fixed percentage of the excess sales (actual sales minus a pre-specified sales goal) by the employee in a quarter (see Exhibit 1). = x Employee's Bonus Where employee's targeted sales for quarter 0.08 Employees hourly wage (Employee's actual sales for quarter employee's targeted sales for quarter) Hours worked in quarter X 12.5 s t i.. . . . .. ... . .. Financial Report for Store: A typical annual income statement for a pre-plan Ladbreck store before fixed charges, taxes and incidentals looks as follows. Total Percent Sales .......... Cost of goods sold .......... Gross profit.. Employee salaries........................ Profit before fixed charges .......... .......... 10,000,000 100 ........... 6,300,000 .. 3,700,000 37 ............. 800,000 ............ 2,900,000 29 ............ A store also has substantial charges for rent, management salaries, insurance, etc. but they are fixed with respect to the incentive plan. Exhibit 1 Wages by subset of employees in Ladbreck's fashion department Years of Service Pay Regular Pay Name BOB MARLEY JIMI HENDRIX .... MILLIE SMALL ... AL GREEN ...... BOB DYLAN....... JANIS JOPLIN WILSON PICKETT BRUCE SPRINGSTEEN MICHIGAN & SMILEY.... RICHIE FURAY ........ JOHN LENNON. JULIO IGLESIAS... TOMMY PETTY JOAN BAEZ BB KING....... GLADYS KNIGHT. NEIL YOUNG BO DIDDLEY ...... Hours Hourly Worked Wage in Rate Quarter 4.00 400 7.50 440 9.99 440 6.00 400 5.00 400 6.00 400 7.50 440 9.99 440 7.00 400 9.90 400 5.00 480 6.00 9.90 6.00 400 8.00 480 8.00 5.00 400 1,600 3,300 4,396 2,400 2,000 2,400 3,300 4,396 2,800 3,960 2,000 2,400 2,400 3,960 2,400 3,840 3,840 2,000 Actual Sales Total for Quarter Bonus Quarter 25,000 400 2,000 41,000 3,300 40,000 4,396 36,000 2,880 30,000 2,400 30,000 2,400 50,000 4,000 30,000 4,396 38,000 240 3,040 30,000 3,960 34,000 720 2,720 46,000 1,280 3,680 36,000 480 2,880 40,000 3,960 38,000 3,040 46,000 3,840 36,000 3,840 30,000 2,400 400 5.00 400 400 480 Figure 1 Percentage Change in Sales Figure 3 Cost of Goods Sold as a Percent of Sales Percent change TTTTTTTTT 12 TTTTTTTTTTTTTTTTTTTTTTT 1 3 5 7 9 11 13 15 17 19 21 23 25 27 29 31 33 35 37 39 41 43 45 47 Month (rollout month-25) 55+TTTTTTTTTTTTTTTTTTTTTT 1 3 5 7 9 11 13 15 17 19 21 23 25 27 29 31 33 35 37 39 41 43 45 47 Month (rollout month-25) Figure 2 Wage Expense as a Percent of Sales Figure 4 Inventory Turnover Percent TTTTTTTTTTTTTTTTI 1 3 5 7 9 11 13 15 17 19 21 23 25 27 29 31 33 35 37 39 41 43 45 47 Month (rollout month-25) TTTTTTTTTTTTTTTI 1 3 5 7 9 11 13 15 17 19 21 23 25 27 29 31 33 35 37 39 41 43 45 47 Month (rollout month-25)