Answered step by step
Verified Expert Solution
Question
1 Approved Answer
a) Suppose you are a data analytics consultant working for a bank and are asked by the bank to study waiting times for service

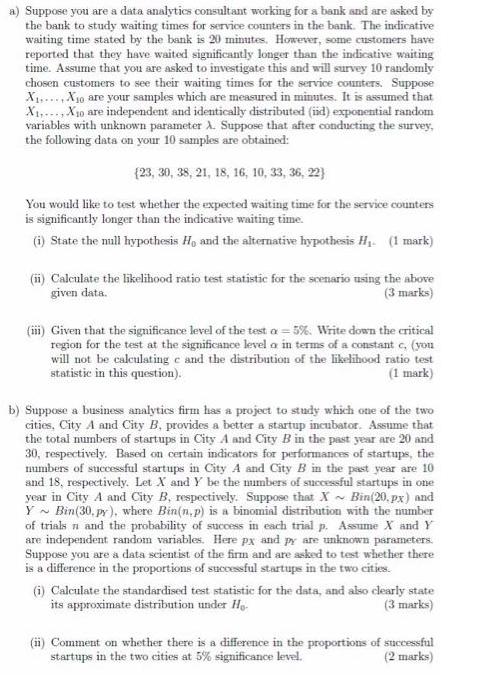
a) Suppose you are a data analytics consultant working for a bank and are asked by the bank to study waiting times for service counters in the bank. The indicative waiting time stated by the bank is 20 minutes. However, some customers have reported that they have waited significantly longer than the indicative waiting time. Assume that you are asked to investigate this and will survey 10 randomly chosen customers to see their waiting times for the service counters. Suppose XXo are your samples which are measured in minutes. It is assumed that X, X0 are independent and identically distributed (iid) exponential random variables with unknown parameter A. Suppose that after conducting the survey, the following data on your 10 samples are obtained: (23, 30, 38, 21, 18, 16, 10, 33, 36, 22) You would like to test whether the expected waiting time for the service counters is significantly longer than the indicative waiting time. (i) State the null hypothesis Ho and the alternative hypothesis H. (1 mark) (ii) Calculate the likelihood ratio test statistic for the scenario using the above given data. (3 marks) (iii) Given that the significance level of the test a = 5%. Write down the critical region for the test at the significance level a in terms of a constant c. (you will not be calculating c and the distribution of the likelihood ratio test statistic in this question). (1 mark) b) Suppose a business analytics firm has a project to study which one of the two cities, City A and City B, provides a better a startup incubator. Assume that the total numbers of startups in City A and City B in the past year are 20 and 30, respectively. Based on certain indicators for performances of startups, the numbers of successful startups in City A and City B in the past year are 10 and 18, respectively. Let X and Y be the numbers of successful startups in one year in City A and City B, respectively. Suppose that X~ Bin(20. px) and Y~ Bin (30. py), where Bin(n,p) is a binomial distribution with the number of trials n and the probability of success in each trial p. Assume X and Y are independent random variables. Here px and py are unknown parameters. Suppose you are a data scientist of the firm and are asked to test whether there is a difference in the proportions of successful startups in the two cities. (i) Calculate the standardised test statistic for the data, and also clearly state its approximate distribution under Ho (3 marks) (ii) Comment on whether there is a difference in the proportions of successful startups in the two cities at 5% significance level. (2 marks)
Step by Step Solution
★★★★★
3.43 Rating (162 Votes )
There are 3 Steps involved in it
Step: 1
a i Ho X 120 H 120 n nX ii Likelihood ratio A e ...
Get Instant Access to Expert-Tailored Solutions
See step-by-step solutions with expert insights and AI powered tools for academic success
Step: 2

Step: 3

Ace Your Homework with AI
Get the answers you need in no time with our AI-driven, step-by-step assistance
Get Started


