Answered step by step
Verified Expert Solution
Question
1 Approved Answer
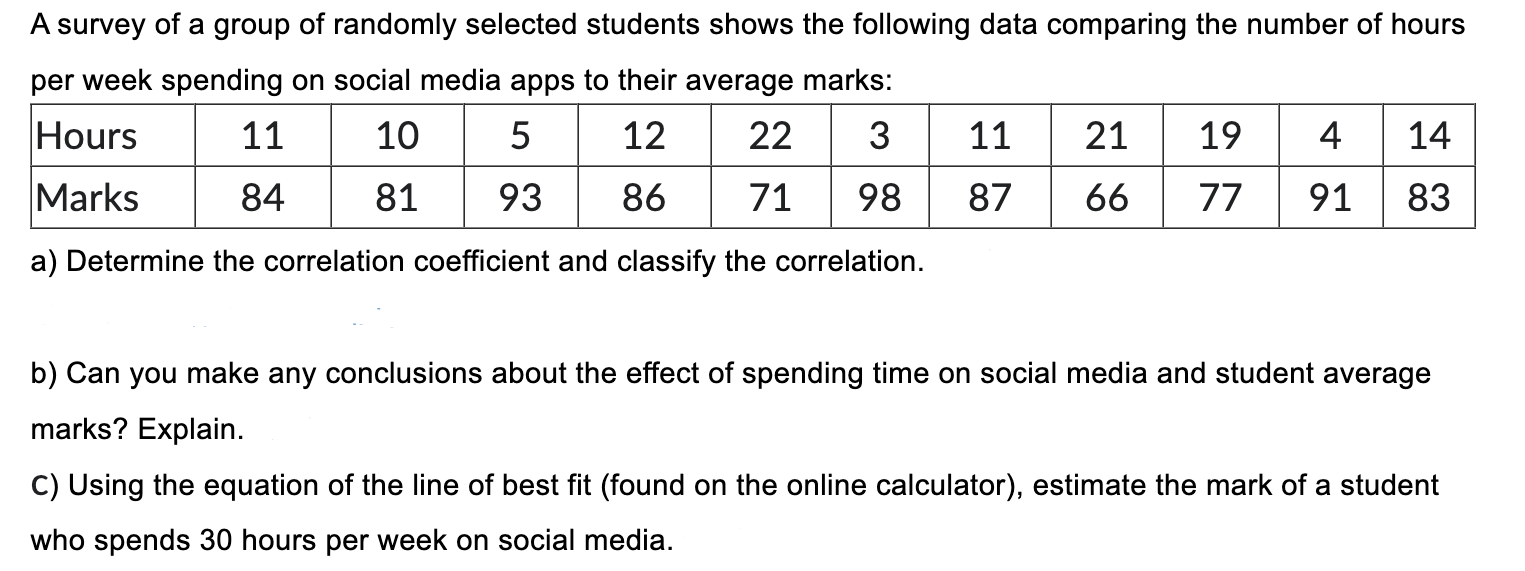
A survey of a group of randomly selected students shows the following data comparing the number of hours per week spending on social media

A survey of a group of randomly selected students shows the following data comparing the number of hours per week spending on social media apps to their average marks: Hours Marks 11 84 10 5 12 22 3 11 21 19 4 14 81 93 86 71 98 87 66 77 91 83 a) Determine the correlation coefficient and classify the correlation. b) Can you make any conclusions about the effect of spending time on social media and student average marks? Explain. C) Using the equation of the line of best fit (found on the online calculator), estimate the mark of a student who spends 30 hours per week on social media.
Step by Step Solution
There are 3 Steps involved in it
Step: 1

Get Instant Access to Expert-Tailored Solutions
See step-by-step solutions with expert insights and AI powered tools for academic success
Step: 2

Step: 3

Ace Your Homework with AI
Get the answers you need in no time with our AI-driven, step-by-step assistance
Get Started


