

Answered step by step
Verified Expert Solution
Question
1 Approved Answer
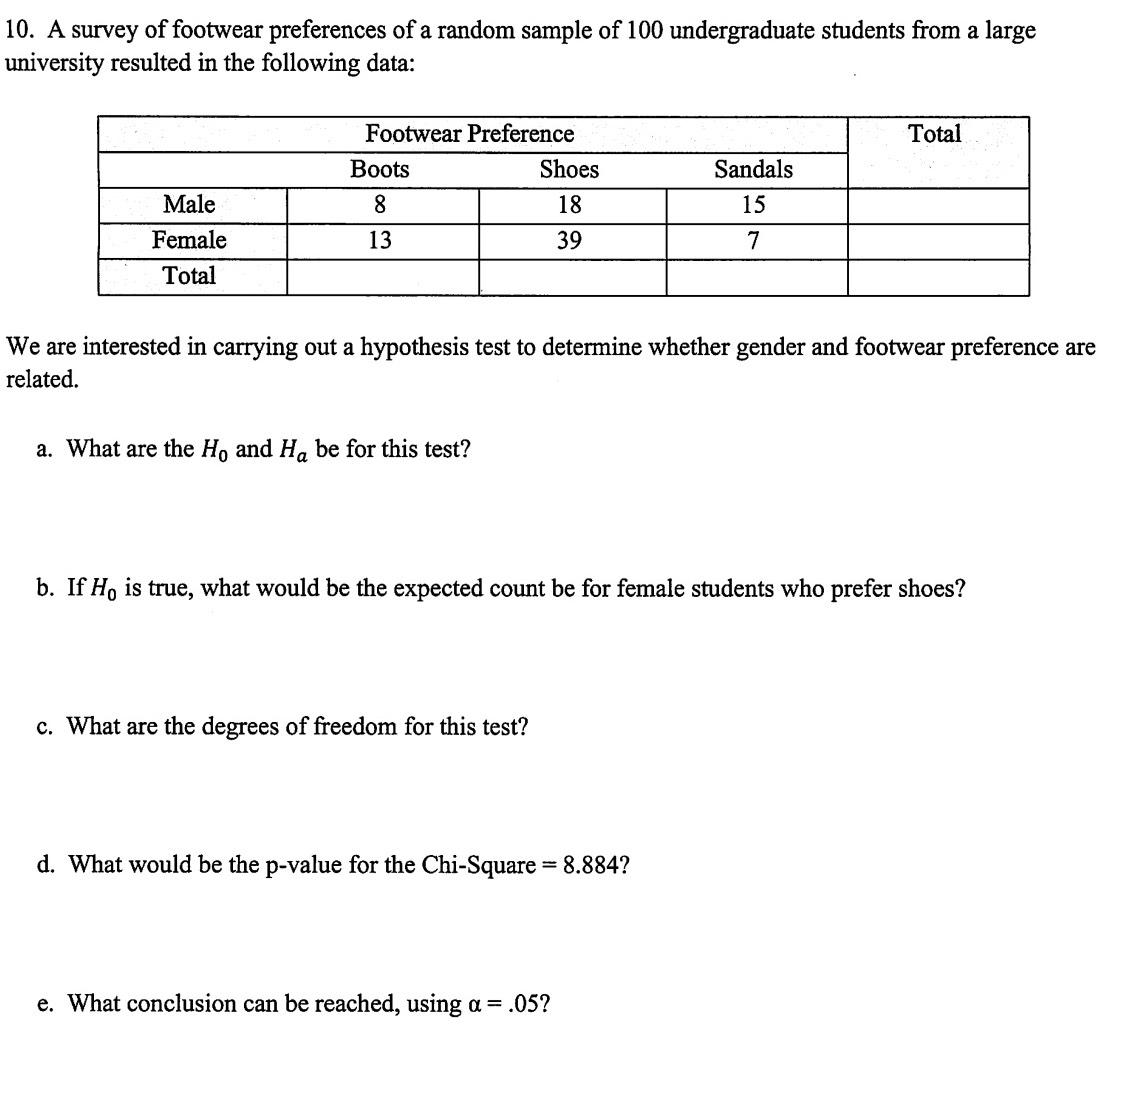
A survey of footwear preferences of a random sample of 1 0 0 undergraduate students from a large university resulted in the following data:
A survey of footwear preferences of a random sample of undergraduate students from a large university resulted in the following data:
tableFootwear Preference,TotalBoots,Shoes,SandalsMaleFemaleTotal
We are interested in carrying out a hypothesis test to determine whether gender and footwear preference are related.
a What are the and be for this test?
b If is true, what would be the expected count be for female students who prefer shoes?
c What are the degrees of freedom for this test?
d What would be the pvalue for the ChiSquare
e What conclusion can be reached, using
Step by Step Solution
There are 3 Steps involved in it
Step: 1

Get Instant Access to Expert-Tailored Solutions
See step-by-step solutions with expert insights and AI powered tools for academic success
Step: 2

Step: 3
Ace Your Homework with AI
Get the answers you need in no time with our AI-driven, step-by-step assistance
Get Started
Making Hard Decisions with decision tools
Authors: Robert Clemen, Terence Reilly
3rd edition
538797576, 978-0538797573