

Question
A survey of mothers' ages at the birth of their child was taken in maternity wards of hospitals across Australia in several years. A representative
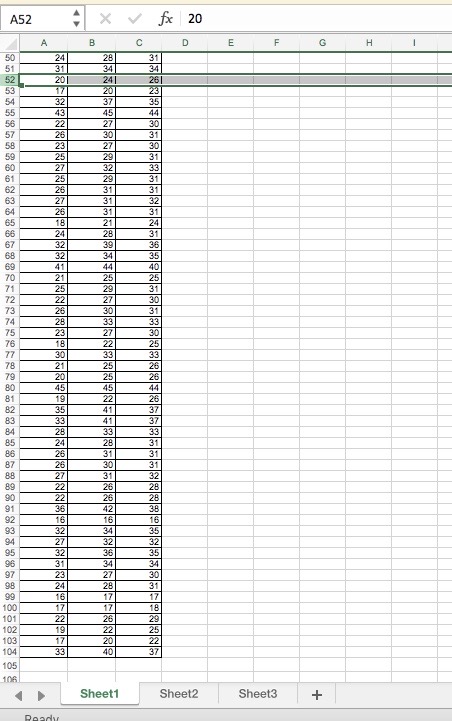
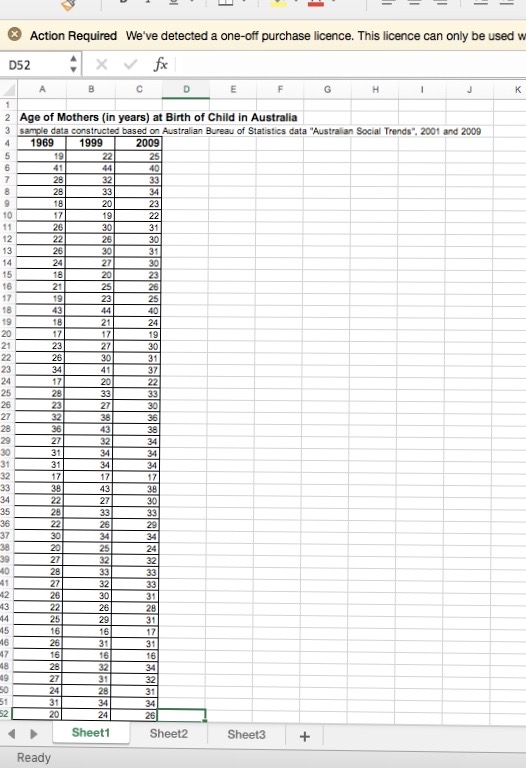
A survey of mothers' ages at the birth of their child was taken in maternity wards of hospitals across Australia in several years. A representative sample of 100 mothers was surveyed in each of the years: 1969, 1999 and 2009. The mothers' ages were recorded and the data is presented in an Excel file: MotherAge.xlsx that can be downloaded from the Moodle page in the "Assessments" block.
a)Determine the five-number summary for the each of the three data sets.
b)Draw a comparative box-plot of the Mothers' ages across the three different years.
c)Comment on any similarities and differences (as shown in the comparative box-plot) in the ages of mothers between the different years.
d)What is the probability of finding a mother who is 30 or more at the time of their child's birth in
i)1969, and in
ii) 2009?
Step by Step Solution
There are 3 Steps involved in it
Step: 1

Get Instant Access to Expert-Tailored Solutions
See step-by-step solutions with expert insights and AI powered tools for academic success
Step: 2

Step: 3
Ace Your Homework with AI
Get the answers you need in no time with our AI-driven, step-by-step assistance
Get Started
Finite Mathematics and Its Applications
Authors: Larry J. Goldstein, David I. Schneider, Martha J. Siegel, Steven Hair
12th edition
978-0134768588, 9780134437767, 134768582, 134437764, 978-0134768632