

Question
I'm doing a bivariate regression analysis in my statistics class and I'm a little confused about what all I need to put in a table
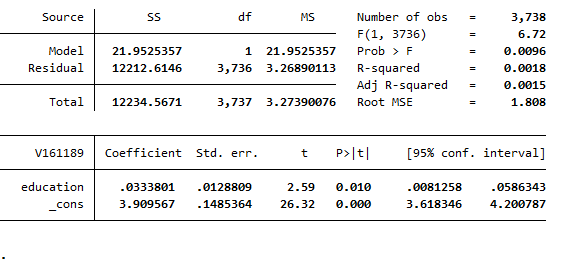
I'm doing a bivariate regression analysis in my statistics class and I'm a little confused about what all I need to put in a table in MS word to work on this project. I'm required to put together a table in MS word reflecting data from this image but I am unsure of what I need to put into the table to complete this section. I am also a bit confused about how to answer the questions by using the data. If someone could explain this to me I would greatly appreciate it!
My data:
Step by Step Solution
There are 3 Steps involved in it
Step: 1

Get Instant Access to Expert-Tailored Solutions
See step-by-step solutions with expert insights and AI powered tools for academic success
Step: 2

Step: 3
Ace Your Homework with AI
Get the answers you need in no time with our AI-driven, step-by-step assistance
Get Started
Finite Mathematics and Its Applications
Authors: Larry J. Goldstein, David I. Schneider, Martha J. Siegel, Steven Hair
12th edition
978-0134768588, 9780134437767, 134768582, 134437764, 978-0134768632