Answered step by step
Verified Expert Solution
Link Copied!

Question

1 Approved Answer

a) The demand for a new product in its first three quarters has been 14.7, 12.3 and 7.5. Using the average method, what is the
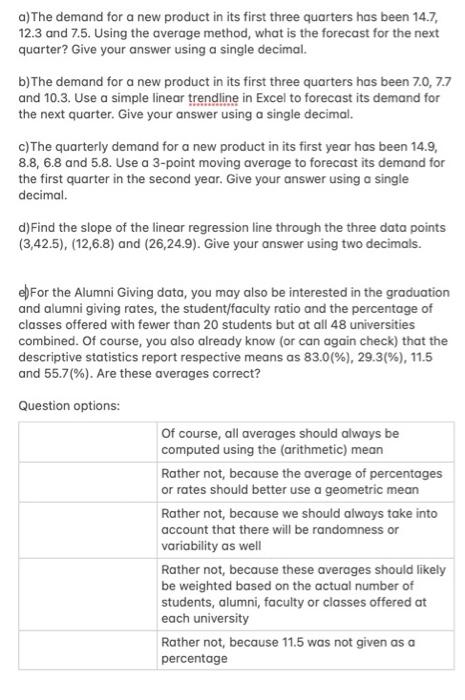
image text in transcribed
a) The demand for a new product in its first three quarters has been 14.7, 12.3 and 7.5. Using the average method, what is the forecast for the next quarter? Give your answer using a single decimal. b) The demand for a new product in its first three quarters has been 7.0,7.7 and 10.3. Use a simple linear trendline in Excel to forecast its demand for the next quarter. Give your answer using a single decimal. c) The quarterly demand for a new product in its first year has been 14.9, 8.8, 6.8 and 5.8. Use a 3-point moving average to forecast its demand for the first quarter in the second year. Give your answer using a single decimal. d)Find the slope of the linear regression line through the three data points (3,42.5),(12,6.8) and (26,24.9). Give your answer using two decimals. e) For the Alumni Giving data, you may also be interested in the graduation and alumni giving rates, the student/faculty ratio and the percentage of classes offered with fewer than 20 students but at all 48 universities combined. Of course, you also already know (or can again check) that the descriptive statistics report respective means as 83.0(%),29.3(%),11.5 and 55.7(%). Are these averages correct? Question options

Step by Step Solution

There are 3 Steps involved in it

Step: 1

blur-text-image

Get Instant Access to Expert-Tailored Solutions

See step-by-step solutions with expert insights and AI powered tools for academic success

Step: 2

blur-text-image

Step: 3

blur-text-image

Ace Your Homework with AI

Get the answers you need in no time with our AI-driven, step-by-step assistance

Get Started

Recommended Textbook for

Audits

Authors: Arthur E Cutforth

1st Edition

1017097445, 978-1017097443

More Books

Students also viewed these Accounting questions