Question
a. The GCC region has been of interest to many researchers around the world, and over the decades, many scholarships have been produced on varied
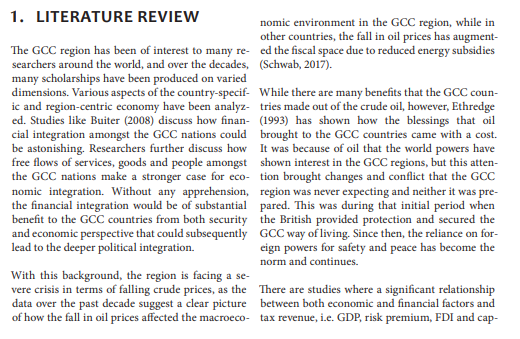
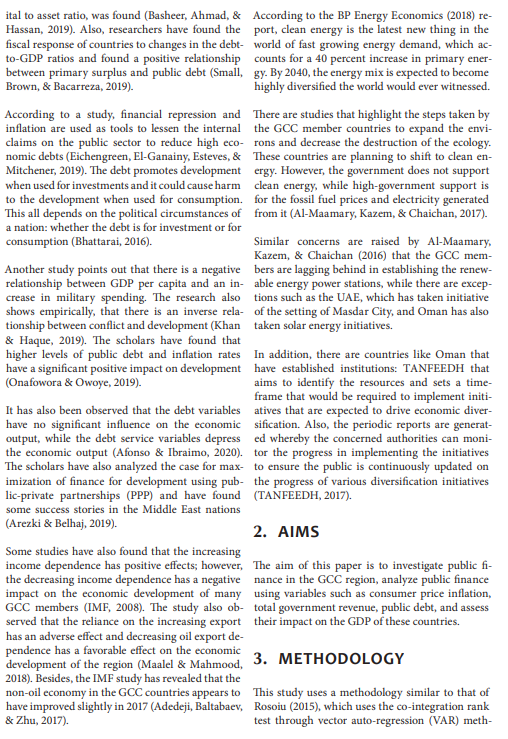
a. The GCC region has been of interest to many researchers around the world, and over the decades, many scholarships have been produced on varied dimensions. Why?
b. What was the purpose of writing this article by the related authors? And what were the main components they were focusing on? Why these areas? Explain in your own words
c. How many countries were involved in the study and what was each Governments expenditure as % of GDP? What overall areas the expenditures were taken place?
d. In the article, Public expenditure, especially in the education sector, will have long-term beneficial results for GCC countries. In your opinion, why? Explain in your own words
e. In your own words, summarize the conclusion and recommendation that were given by authors.
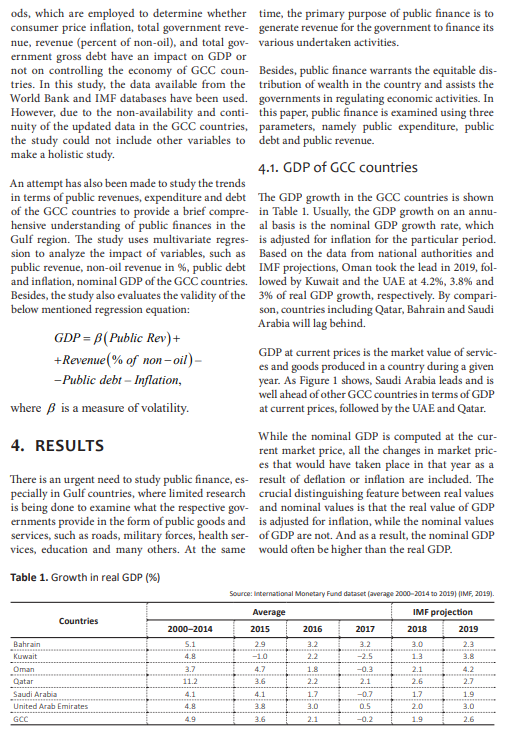
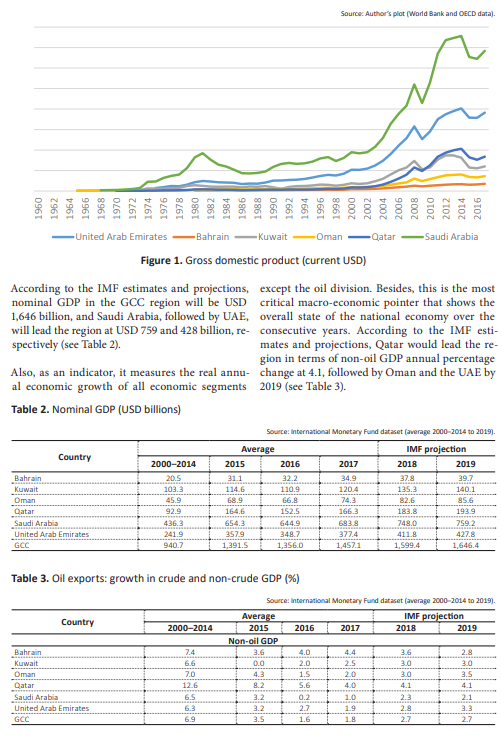
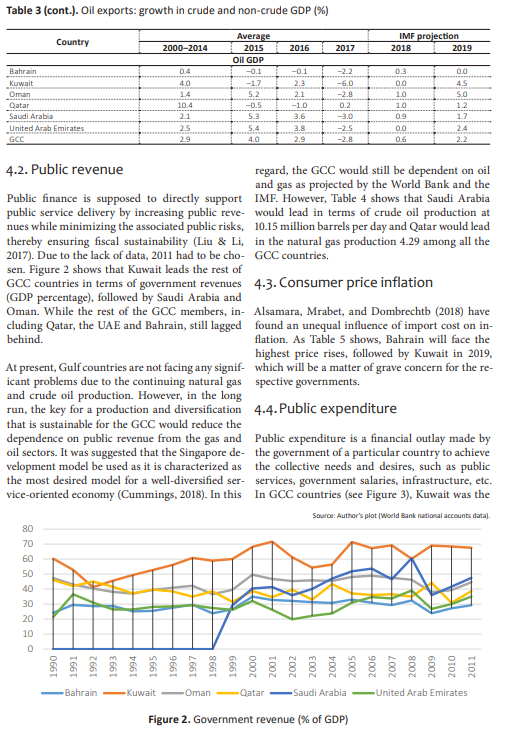
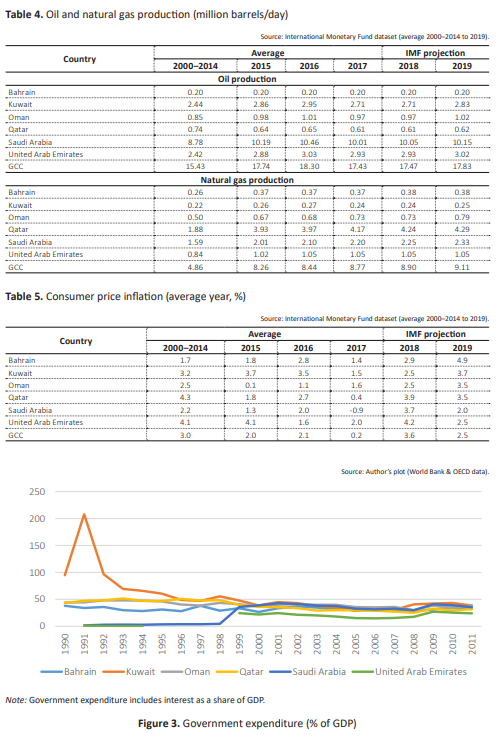
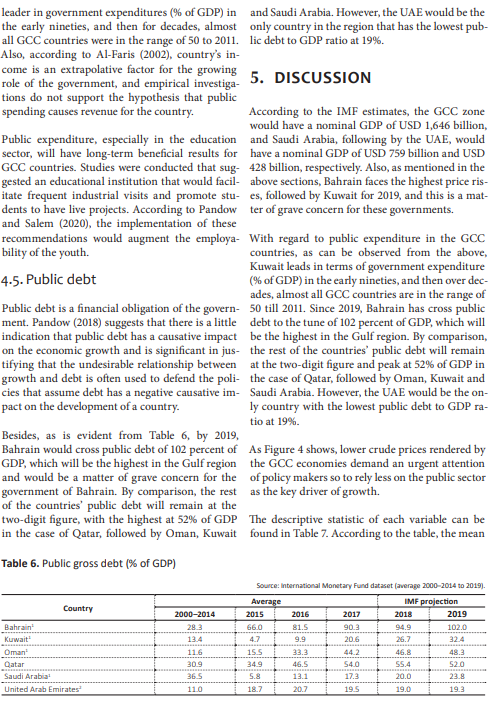
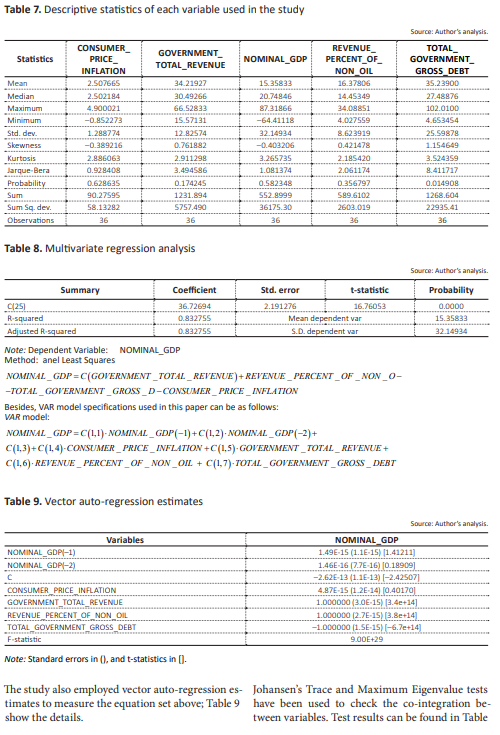
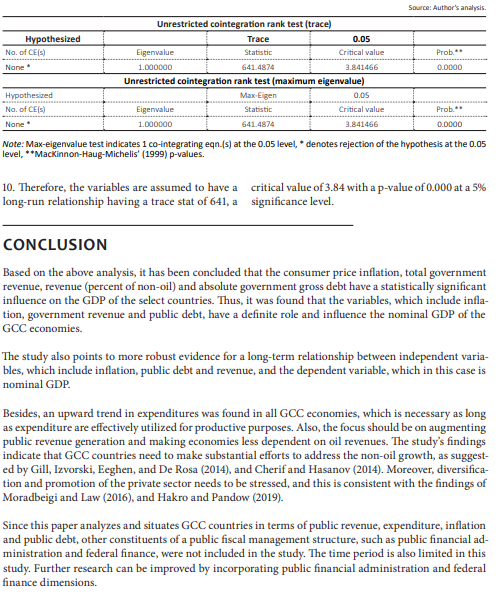
1. LITERATURE REVIEW nomic environment in the GCC region, while in other countries, the fall in oil prices has augment- The GCC region has been of interest to many re- ed the fiscal space due to reduced energy subsidies searchers around the world, and over the decades, (Schwab, 2017). many scholarships have been produced on varied dimensions. Various aspects of the country-specif- While there are many benefits that the GCC coun- ic and region-centric economy have been analyz- tries made out of the crude oil, however, Ethredge ed. Studies like Buiter (2008) discuss how finan- (1993) has shown how the blessings that oil cial integration amongst the GCC nations could brought to the GCC countries came with a cost. be astonishing. Researchers further discuss how It was because of oil that the world powers have free flows of services, goods and people amongst shown interest in the GCC regions, but this atten- the GCC nations make a stronger case for eco- tion brought changes and conflict that the GCC nomic integration. Without any apprehension, region was never expecting and neither it was pre- the financial integration would be of substantial pared. This was during that initial period when benefit to the GCC countries from both security the British provided protection and secured the and economic perspective that could subsequently GCC way of living. Since then, the reliance on for- lead to the deeper political integration. eign powers for safety and peace has become the norm and continues. With this background, the region is facing a se- vere crisis in terms of falling crude prices, as the There are studies where a significant relationship data over the past decade suggest a clear picture between both economic and financial factors and of how the fall in oil prices affected the macroeco- tax revenue, i.e. GDP, risk premium, FDI and cap- ital to asset ratio, was found (Basheer, Ahmad, & According to the BP Energy Economics (2018) re- Hassan, 2019). Also, researchers have found the port, clean energy is the latest new thing in the fiscal response of countries to changes in the debt- world of fast growing energy demand, which ac- to-GDP ratios and found a positive relationship counts for a 40 percent increase in primary ener- between primary surplus and public debt (Small, gy. By 2040, the energy mix is expected to become Brown, & Bacarreza, 2019). highly diversified the world would ever witnessed. According to a study, financial repression and There are studies that highlight the steps taken by inflation are used as tools to lessen the internal the GCC member countries to expand the envi- claims on the public sector to reduce high eco- rons and decrease the destruction of the ecology nomic debts (Eichengreen, El-Ganainy, Esteves, & These countries are planning to shift to clean en- Mitchener, 2019). The debt promotes development ergy. However, the government does not support when used for investments and it could cause harm clean energy, while high-government support is to the development when used for consumption for the fossil fuel prices and electricity generated This all depends on the political circumstances of from it (Al-Maamary, Kazem, & Chaichan, 2017). a nation: whether the debt is for investment or for consumption (Bhattarai, 2016). Similar concerns are raised by Al-Maamary, Kazem, & Chaichan (2016) that the GCC mem- Another study points out that there is a negative bers are lagging behind in establishing the renew- relationship between GDP per capita and an in-able energy power stations, while there are excep- crease in military spending. The research also tions such as the UAE, which has taken initiative shows empirically, that there is an inverse rela- of the setting of Masdar City, and Oman has also tionship between conflict and development (Khan taken solar energy initiatives. & Haque, 2019). The scholars have found that higher levels of public debt and inflation rates In addition, there are countries like Oman that have a significant positive impact on development have established institutions: TANFEEDH that (Onafowora & Owoye, 2019). aims to identify the resources and sets a time- frame that would be required to implement initi- It has also been observed that the debt variables atives that are expected to drive economic diver- have no significant influence on the economic sification. Also, the periodic reports are generat- output, while the debt service variables depressed whereby the concerned authorities can moni- the economic output (Afonso & Ibraimo, 2020). tor the progress in implementing the initiatives The scholars have also analyzed the case for max- to ensure the public is continuously updated on imization of finance for development using pub- the progress of various diversification initiatives lic-private partnerships (PPP) and have found (TANFEEDH, 2017). some success stories in the Middle East nations (Arezki & Belhaj, 2019). 2. AIMS Some studies have also found that the increasing income dependence has positive effects; however, The aim of this paper is to investigate public fi- the decreasing income dependence has a negative nance in the GCC region, analyze public finance impact on the economic development of many using variables such as consumer price inflation, GCC members (IMF, 2008). The study also ob- total government revenue, public debt, and assess served that the reliance on the increasing export their impact on the GDP of these countries. has an adverse effect and decreasing oil export de- pendence has a favorable effect on the economic development of the region (Maalel & Mahmood, 3. METHODOLOGY 2018). Besides, the IMF study has revealed that the non-oil economy in the GCC countries appears to This study uses a methodology similar to that of have improved slightly in 2017 (Adedeji, Baltabaev, Rosoiu (2015), which uses the co-integration rank & Zhu, 2017). test through vector auto-regression (VAR) meth- ods, which are employed to determine whether time, the primary purpose of public finance is to consumer price inflation, total government reve- generate revenue for the government to finance its nue, revenue (percent of non-oil), and total gov- various undertaken activities. ernment gross debt have an impact on GDP or not on controlling the economy of GCC coun- Besides, public finance warrants the equitable dis- tries. In this study, the data available from the tribution of wealth in the country and assists the World Bank and IMF databases have been used. governments in regulating economic activities. In However, due to the non-availability and conti- this paper, public finance is examined using three nuity of the updated data in the GCC countries, parameters, namely public expenditure, public the study could not include other variables to debt and public revenue. make a holistic study. 4.1. GDP of GCC countries An attempt has also been made to study the trends in terms of public revenues, expenditure and debt The GDP growth in the GCC countries is shown of the GCC countries to provide a brief compre- in Table 1. Usually, the GDP growth on an annu- hensive understanding of public finances in the al basis is the nominal GDP growth rate, which Gulf region. The study uses multivariate regres- is adjusted for inflation for the particular period. sion to analyze the impact of variables, such as Based on the data from national authorities and public revenue, non-oil revenue in %, public debt IMF projections, Oman took the lead in 2019, fol- and inflation, nominal GDP of the GCC countries. lowed by Kuwait and the UAE at 4.2%, 3.8% and Besides, the study also evaluates the validity of the 3% of real GDP growth, respectively. By compari- below mentioned regression equation: son, countries including Qatar, Bahrain and Saudi Arabia will lag behind. GDP = B(Public Rev)+ +Revenue (% of non-oil) - GDP at current prices is the market value of servic- es and goods produced in a country during a given - Public debt - Inflation, year. As Figure 1 shows, Saudi Arabia leads and is well ahead of other GCC countries in terms of GDP where B is a measure of volatility. at current prices, followed by the UAE and Qatar. While the nominal GDP is computed at the cur- 4. RESULTS rent market price, all the changes in market pric- es that would have taken place in that year as a There is an urgent need to study public finance, es result of deflation or inflation are included. The pecially in Gulf countries, where limited research crucial distinguishing feature between real values is being done to examine what the respective gov- and nominal values is that the real value of GDP ernments provide in the form of public goods and is adjusted for inflation, while the nominal values services, such as roads, military forces, health ser- of GDP are not. And as a result, the nominal GDP vices, education and many others. At the same would often be higher than the real GDP. Table 1. Growth in real GDP (%) Source: international Monetary Fund dataset (average 2000-2014 to 2019) (IMF, 2019). IMF projection Countries Average 2015 2000-2014 2016 2017 2018 2019 3.0 3.2 2.2 1.8 1.3 Bahrain Kuwait Oman Qatar Saudi Arabia United Arab Emirates GCC 5.1 4.8 3.7 11.2 4.1 4.8 4.9 2.9 -10 4.7 3.6 4.1 3.8 3.2 -2.5 -0.3 2.1 2.2 2.1 2.6 1.7 2.0 ISICININIS 2.3 3.8 4.2 2.7 1.9 3.0 2.6 -07 1.7 3.0 0.5 -0.2 3.6 2.1 1.9 Source: Author's plot World Bank and OECD data) 1960 1962 1964 1966 1968 1970 1972 1974 1976 1978 1980 1982 1984 1986 1988 1990 1992 1994 1996 1998 2000 2002 966 800 00G 2007 Vog 2004 2006 2008 2008 2010 2012 2014 2016 TOZ United Arab Emirates Bahrain -Kuwait Oman Qatar Saudi Arabia Figure 1. Gross domestic product (current USD) According to the IMF estimates and projections, except the oil division. Besides, this is the most nominal GDP in the GCC region will be USD critical macro-economic pointer that shows the 1,646 billion, and Saudi Arabia, followed by UAE, overall state of the national economy over the will lead the region at USD 759 and 428 billion, re- consecutive years. According to the IMF esti- spectively (see Table 2). mates and projections, Qatar would lead the re- gion in terms of non-oil GDP annual percentage Also, as an indicator, it measures the real annu- change at 4.1, followed by Oman and the UAE by al economic growth of all economic segments 2019 (see Table 3). Table 2. Nominal GDP (USD billions) Country 2015 2000-2014 20.5 103.3 Source: International Monetary Fund dataset (average 2000-2014 to 2019). Average IMF projection 2016 2017 2018 2019 31.1 32.2 34.9 37.8 39.7 114.6 110.9 120.4 135.3 140.1 68.9 66.8 74.3 164.6 152.5 1663 183.8 1939 6543 644.9 6938 749.0 7592 3579 348.7 377.4 4118 427.8 1,391.5 1,356.0 1,4571 1,599.4 1,646.4 82.6 Bahrain Kuwait Oman Qatar Saudi Arabia United Arab Emirates GCC 85.6 92.9 436.3 2419 940.7 Table 3. Oil exports: growth in crude and non-crude GDP (%) Country 2000-2014 7.4 Bahrain Kuwait Oman Qatar Saudi Arabia United Arab Emirates GCC Source: International Monetary Fund dataset (average 2000-2014 to 2019). Average IMF projection 2015 2016 2017 2018 2019 Non-oil GDP 3.6 40 4.4 3.6 2.8 0.0 2.0 2.5 3.0 3.0 4.3 1.5 2.0 3.0 3.5 8.2 S.6 4.0 4.1 4.1 3.2 0.2 1.0 2.3 2.1 3.2 2.7 1.9 2.8 3.3 3.5 1.6 1.8 2.7 2.7 7.0 12.6 6.5 6.3 6.9 Table 3 (cont.). Oil exports: growth in crude and non-crude GDP (%) Country IMF projection 2018 2019 2000-2014 2016 2017 0.4 0.3 010 Bahrain Kuwait Oman Qatar Saudi Arabia United Arab Emirates GCC 40 1.4 10.4 2.1 25 29 Average 2015 oil GDP -0.1 -17 5.2 -0.5 5.3 5.4 4.0 -0.1 2.3 2.1 -1.0 3.6 -2.2 -6.0 -2.8 0.2 -3.0 -2.5 -2.8 0.0 1.0 1.0 0.9 0.0 0.6 4.5 S.O 1.2 1.7 24 2.2 2.9 4.2. Public revenue regard, the GCC would still be dependent on oil and gas as projected by the World Bank and the Public finance is supposed to directly support IMF. However, Table 4 shows that Saudi Arabia public service delivery by increasing public reve- would lead in terms of crude oil production at nues while minimizing the associated public risks, 10.15 million barrels per day and Qatar would lead thereby ensuring fiscal sustainability (Liu & Li, in the natural gas production 4.29 among all the 2017). Due to the lack of data, 2011 had to be cho- GCC countries. sen. Figure 2 shows that Kuwait leads the rest of GCC countries in terms of government revenues 4.3. Consumer price inflation (GDP percentage), followed by Saudi Arabia and Oman. While the rest of the GCC members, in- Alsamara, Mrabet, and Dombrechtb (2018) have cluding Qatar, the UAE and Bahrain, still lagged found an unequal influence of import cost on in- behind. flation. As Table 5 shows, Bahrain will face the highest price rises, followed by Kuwait in 2019, At present, Gulf countries are not facing any signif- which will be a matter of grave concern for the re- icant problems due to the continuing natural gas spective governments. and crude oil production. However, in the long run, the key for a production and diversification 4.4. Public expenditure that is sustainable for the GCC would reduce the dependence on public revenue from the gas and Public expenditure is a financial outlay made by oil sectors. It was suggested that the Singapore de- the government of a particular country to achieve velopment model be used as it is characterized as the collective needs and desires, such as public the most desired model for a well-diversified ser- services, government salaries, infrastructure, etc. vice-oriented economy (Cummings, 2018). In this In GCC countries (see Figure 3), Kuwait was the Source: Author's plot (World Bank national accounts data). 80 70 60 50 40 30 20 10 0 1990 1991 1992 1993 1994 # 1995 1996 1997 1998 1999 2000 2001 2002 2003 2004 2005 2006 Bahrain Kuwait Oman Qatar Saudi Arabia United Arab Emirates Figure 2. Government revenue (% of GDP) Table 4. Oil and natural gas production (million barrels/day) Country 2.86 2.95 Bahrain Kuwait Oman Qatar Saudi Arabia United Arab Emirates GCC Source: International Monetary Fund dataset (average 2000-2014 to 2019). Average IMF projection 2000-2014 2015 2016 2017 2018 2019 Oil production 0.20 0.20 0.20 0.20 0.20 0.20 2.44 2.71 2.71 2.83 0.95 0.98 1.01 0.97 0.97 1.02 0.74 0.64 0.65 0.61 0.61 0.62 8.78 10.19 10.46 10.01 10.05 10.15 2.42 2.88 3.03 2.93 2.93 3.02 15.43 17.74 18.30 17.43 17.47 17.83 Natural gas production 0.26 0.37 0.37 0.37 0.38 0.22 0.26 0.27 0.24 0.24 0.25 0.50 0.67 0.68 0.73 0.73 0.79 1.88 3.93 3.97 4.17 4.24 4.29 1.59 2.01 2.10 2.20 2.25 2.33 0.84 1.02 1.05 1.05 1.05 1.05 4.86 8.26 8.44 8.77 8.90 9.11 028 Bahrain Kuwait Oman Qatar Saudi Arabia United Arab Emirates GCC Table 5. Consumer price inflation (average year, %) Country Bahrain Kuwait Oman Qatar Saudi Arabia United Arab Emirates GCC 2000-2014 1.7 3.2 2.5 4.3 2.2 4.1 3.0 Source: International Monetary Fund dataset (average 2000-2014 to 2019). Average IMF projection 2015 2016 2017 2018 2019 1.8 2.8 1.4 2.9 49 3.7 3.5 1.5 2.5 3.7 0.1 1.1 1.6 2.5 3.5 1.8 2.7 0.4 3.9 3.5 1.3 2.0 -0.9 3.7 2.0 4.1 1.6 2.0 4.2 2.5 2.0 2.1 0.2 3.6 2.5 Source: Author's plot (World Bank & OECD data) 250 200 150 100 50 0 1990 1991 1992 1993 1994 1995 9661 1997 2000 2001 2002 2003 2004 2005 2006 2007 Bahrain Kuwait Oman Qatar Saudi Arabia United Arab Emirates Note: Government expenditure includes interest as a share of GDP. Figure 3. Government expenditure (% of GDP) leader in government expenditures (% of GDP) in and Saudi Arabia. However, the UAE would be the the early nineties, and then for decades, almost only country in the region that has the lowest pub- all GCC countries were in the range of 50 to 2011. lic debt to GDP ratio at 19%. Also, according to Al-Faris (2002), country's in- come is an extrapolative factor for the growing 5. DISCUSSION role of the government, and empirical investiga- tions do not support the hypothesis that public spending causes revenue for the country. According to the IMF estimates, the GCC zone would have a nominal GDP of USD 1,646 billion, Public expenditure, especially in the education and Saudi Arabia, following by the UAE, would sector, will have long-term beneficial results for have a nominal GDP of USD 759 billion and USD GCC countries. Studies were conducted that sug- 428 billion, respectively. Also, as mentioned in the gested an educational institution that would facil- above sections, Bahrain faces the highest price ris- itate frequent industrial visits and promote stu- es, followed by Kuwait for 2019, and this is a mat- dents to have live projects. According to Pandow ter of grave concern for these governments. and Salem (2020), the implementation of these recommendations would augment the employa- With regard to public expenditure in the GCC bility of the youth. countries, as can be observed from the above, Kuwait leads in terms of government expenditure 4.5. Public debt (% of GDP) in the early nineties, and then over dec- ades, almost all GCC countries are in the range of Public debt is a financial obligation of the govern- 50 till 2011. Since 2019, Bahrain has cross public ment. Pandow (2018) suggests that there is a little debt to the tune of 102 percent of GDP, which will indication that public debt has a causative impact be the highest in the Gulf region. By comparison, on the economic growth and is significant in jus- the rest of the countries" public debt will remain tifying that the undesirable relationship between at the two-digit figure and peak at 52% of GDP in growth and debt is often used to defend the poli- the case of Qatar, followed by Oman, Kuwait and cies that assume debt has a negative causative im- Saudi Arabia. However, the UAE would be the on- pact on the development of a country. ly country with the lowest public debt to GDP ra- tio at 19%. Besides, as is evident from Table 6, by 2019, Bahrain would cross public debt of 102 percent of As Figure 4 shows, lower crude prices rendered by GDP, which will be the highest in the Gulf region the GCC economies demand an urgent attention and would be a matter of grave concern for the of policy makers so to rely less on the public sector government of Bahrain. By comparison, the rest as the key driver of growth. of the countries' public debt will remain at the two-digit figure, with the highest at 52% of GDP The descriptive statistic of each variable can be in the case of Qatar, followed by Oman, Kuwait found in Table 7. According to the table, the mean Table 6. Public gross debt (% of GDP) Source: International Monetary Fund dataset (average 2000-2014 to 2019). Country 2017 90.3 20.6 Bahrain Kuwait Oman Qatar Saudi Arabia United Arab Emirates 2000-2014 28.3 13.4 116 30.9 36.5 11.0 Average 2015 66.0 4.7 15.5 34.9 5.8 18.7 2016 81.5 9.9 33.3 46.5 13.1 20.7 IMF projection 2018 2019 94.9 102.0 26.7 46.8 48.3 SS.4 52.0 20.0 23.8 19.0 19.3 . 44.2 540 17.3 19.5 Table 7. Descriptive statistics of each variable used in the study Source: Author's analysis Statistics GOVERNMENT TOTAL_REVENUE NOMINAL_GDP Mean CONSUMER PRICE INFLATION 2.507665 2.502184 4.900021 -0.952273 1.288274 -0.389216 2.886063 0.929408 0.628635 90.27595 58.13282 36 34.21927 20.49266 66.52833 15.57131 12.82574 0.761882 Median Maximum Minimum Std. dev. Skewness Kurtosis Jarque-Bera Probability Sum Sum Sq.dev. Observations 15.35833 20.74846 87.31866 -64.41118 32.14934 -0.403206 3.265735 1.091374 0.582348 S52.9999 36175.30 36 REVENUE PERCENT_OF NON OIL 16.37906 14.45349 34.08851 4.027559 8.623919 0.421478 2.185420 2.061174 0.356797 589.6102 2603.019 TOTAL GOVERNMENT GROSS DEBT 35.23900 27.48876 102.0100 4.663454 25.59878 1.154649 3.524359 8.411717 0.014908 1268.604 22935.41 36 2.911298 3.494586 0.174245 1231.894 S757.490 36 26 Table 8. Multivariate regression analysis Source: Author's analysis Probability 0.0000 15 35833 32.14934 Summary Coefficient Std. error t-statistic C1251 36.72694 2.191276 16.76053 R-squared 0.832755 Mean dependent var Adjusted R squared 0.832755 S.D. dependent var Note: Dependent Variable: NOMINAL_GDP Method: anel Least squares NOMINAL_GDP =C(GOVERNMENT _TOTAL_REVENUE) + REVENUE_PERCENT_OF_NON_O- -TOTAL_GOVERNMENT_GROSS_D-CONSUMER_PRICE_INFLATION Besides, VAR model specifications used in this paper can be as follows: VAR model: NOMINAL_GDP =C(1,1). NOMINAL_GDP(-1)+C(1,2). NOMINAL_GDP(-2) + C(1,3)+C(1,4)-CONSUMER_PRICE_INFLATION + C(1,5)-GOVERNMENT_TOTAL_REVENUE + C(1,6). REVENUE_PERCENT_OF_NON_OL + C(1,7)- TOTAL_GOVERNMENT_GROSS_DEBT Table 9. Vector auto-regression estimates Variables NOMINAL_GDP-1) NOMINAL GDP-2) C CONSUMER_PRICE_INFLATION GOVERNMENT_TOTAL_REVENUE REVENUE PERCENT OF NON OIL TOTAL GOVERNMENT GROSS DEBT F.statistic Source: Author's analysis. NOMINAL_GDP 1.49E-15 (1.1E-15) [1.41211) 1.46E-16 7.7E-16) (0.18909 -2.62E-13 (1.1E-13) (-2.42507 4.87E-15 (1.2E-14 0.40170 1.000000 (3.0E-15) 3.4+14) 1.000000 12.7E-15) 3.8e-141. -1.000000 (1.SE-15) -6.7e+14) 9.00E+29 Note: Standard errors in (), and t-statistics in (). The study also employed vector auto-regression es- Johansen's Trace and Maximum Eigenvalue tests timates to measure the equation set above; Table 9 have been used to check the co-integration be- show the details. tween variables. Test results can be found in Table None Source: Author's analysis. Unrestricted cointegration rank test (trace) Hypothesized Trace 0.05 No. of CES) Eigenvalue Statistic Critical value Prob. 1.000000 641.4874 3.841466 0.0000 Unrestricted cointegration rank test (maximum eigenvalue) Hypothesized Max Eigen 0.05 No. of CES) Eigenvalue Statistic Critical value Proba None 1.000000 641.4874 3.841466 0.0000 Note: Max-eigenvalue test indicates 1 co-integrating egn(s) at the 0.05 level, * denotes rejection of the hypothesis at the 0.05 . level, **Mackinnon-Haug-Michelis' (1999) p-values. 10. Therefore, the variables are assumed to have a critical value of 3.84 with a p-value of 0.000 at a 5% long-run relationship having a trace stat of 641, a significance level. CONCLUSION Based on the above analysis, it has been concluded that the consumer price inflation, total government revenue, revenue (percent of non-oil) and absolute government gross debt have a statistically significant influence on the GDP of the select countries. Thus, it was found that the variables, which include infla- tion, government revenue and public debt, have a definite role and influence the nominal GDP of the GCC economies. The study also points to more robust evidence for a long-term relationship between independent varia- bles, which include inflation, public debt and revenue, and the dependent variable, which in this case is nominal GDP Besides, an upward trend in expenditures was found in all GCC economies, which is necessary as long as expenditure are effectively utilized for productive purposes. Also, the focus should be on augmenting public revenue generation and making economies less dependent on oil revenues. The study's findings indicate that GCC countries need to make substantial efforts to address the non-oil growth, as suggest- ed by Gill, Izvorski, Eeghen, and De Rosa (2014), and Cherif and Hasanov (2014). Moreover, diversifica- tion and promotion of the private sector needs to be stressed, and this is consistent with the findings of Moradbeigi and Law (2016), and Hakro and Pandow (2019). Since this paper analyzes and situates GCC countries in terms of public revenue, expenditure, inflation and public debt, other constituents of a public fiscal management structure, such as public financial ad- ministration and federal finance, were not included in the study. The time period is also limited in this study. Further research can be improved by incorporating public financial administration and federal finance dimensions. 1. LITERATURE REVIEW nomic environment in the GCC region, while in other countries, the fall in oil prices has augment- The GCC region has been of interest to many re- ed the fiscal space due to reduced energy subsidies searchers around the world, and over the decades, (Schwab, 2017). many scholarships have been produced on varied dimensions. Various aspects of the country-specif- While there are many benefits that the GCC coun- ic and region-centric economy have been analyz- tries made out of the crude oil, however, Ethredge ed. Studies like Buiter (2008) discuss how finan- (1993) has shown how the blessings that oil cial integration amongst the GCC nations could brought to the GCC countries came with a cost. be astonishing. Researchers further discuss how It was because of oil that the world powers have free flows of services, goods and people amongst shown interest in the GCC regions, but this atten- the GCC nations make a stronger case for eco- tion brought changes and conflict that the GCC nomic integration. Without any apprehension, region was never expecting and neither it was pre- the financial integration would be of substantial pared. This was during that initial period when benefit to the GCC countries from both security the British provided protection and secured the and economic perspective that could subsequently GCC way of living. Since then, the reliance on for- lead to the deeper political integration. eign powers for safety and peace has become the norm and continues. With this background, the region is facing a se- vere crisis in terms of falling crude prices, as the There are studies where a significant relationship data over the past decade suggest a clear picture between both economic and financial factors and of how the fall in oil prices affected the macroeco- tax revenue, i.e. GDP, risk premium, FDI and cap- ital to asset ratio, was found (Basheer, Ahmad, & According to the BP Energy Economics (2018) re- Hassan, 2019). Also, researchers have found the port, clean energy is the latest new thing in the fiscal response of countries to changes in the debt- world of fast growing energy demand, which ac- to-GDP ratios and found a positive relationship counts for a 40 percent increase in primary ener- between primary surplus and public debt (Small, gy. By 2040, the energy mix is expected to become Brown, & Bacarreza, 2019). highly diversified the world would ever witnessed. According to a study, financial repression and There are studies that highlight the steps taken by inflation are used as tools to lessen the internal the GCC member countries to expand the envi- claims on the public sector to reduce high eco- rons and decrease the destruction of the ecology nomic debts (Eichengreen, El-Ganainy, Esteves, & These countries are planning to shift to clean en- Mitchener, 2019). The debt promotes development ergy. However, the government does not support when used for investments and it could cause harm clean energy, while high-government support is to the development when used for consumption for the fossil fuel prices and electricity generated This all depends on the political circumstances of from it (Al-Maamary, Kazem, & Chaichan, 2017). a nation: whether the debt is for investment or for consumption (Bhattarai, 2016). Similar concerns are raised by Al-Maamary, Kazem, & Chaichan (2016) that the GCC mem- Another study points out that there is a negative bers are lagging behind in establishing the renew- relationship between GDP per capita and an in-able energy power stations, while there are excep- crease in military spending. The research also tions such as the UAE, which has taken initiative shows empirically, that there is an inverse rela- of the setting of Masdar City, and Oman has also tionship between conflict and development (Khan taken solar energy initiatives. & Haque, 2019). The scholars have found that higher levels of public debt and inflation rates In addition, there are countries like Oman that have a significant positive impact on development have established institutions: TANFEEDH that (Onafowora & Owoye, 2019). aims to identify the resources and sets a time- frame that would be required to implement initi- It has also been observed that the debt variables atives that are expected to drive economic diver- have no significant influence on the economic sification. Also, the periodic reports are generat- output, while the debt service variables depressed whereby the concerned authorities can moni- the economic output (Afonso & Ibraimo, 2020). tor the progress in implementing the initiatives The scholars have also analyzed the case for max- to ensure the public is continuously updated on imization of finance for development using pub- the progress of various diversification initiatives lic-private partnerships (PPP) and have found (TANFEEDH, 2017). some success stories in the Middle East nations (Arezki & Belhaj, 2019). 2. AIMS Some studies have also found that the increasing income dependence has positive effects; however, The aim of this paper is to investigate public fi- the decreasing income dependence has a negative nance in the GCC region, analyze public finance impact on the economic development of many using variables such as consumer price inflation, GCC members (IMF, 2008). The study also ob- total government revenue, public debt, and assess served that the reliance on the increasing export their impact on the GDP of these countries. has an adverse effect and decreasing oil export de- pendence has a favorable effect on the economic development of the region (Maalel & Mahmood, 3. METHODOLOGY 2018). Besides, the IMF study has revealed that the non-oil economy in the GCC countries appears to This study uses a methodology similar to that of have improved slightly in 2017 (Adedeji, Baltabaev, Rosoiu (2015), which uses the co-integration rank & Zhu, 2017). test through vector auto-regression (VAR) meth- ods, which are employed to determine whether time, the primary purpose of public finance is to consumer price inflation, total government reve- generate revenue for the government to finance its nue, revenue (percent of non-oil), and total gov- various undertaken activities. ernment gross debt have an impact on GDP or not on controlling the economy of GCC coun- Besides, public finance warrants the equitable dis- tries. In this study, the data available from the tribution of wealth in the country and assists the World Bank and IMF databases have been used. governments in regulating economic activities. In However, due to the non-availability and conti- this paper, public finance is examined using three nuity of the updated data in the GCC countries, parameters, namely public expenditure, public the study could not include other variables to debt and public revenue. make a holistic study. 4.1. GDP of GCC countries An attempt has also been made to study the trends in terms of public revenues, expenditure and debt The GDP growth in the GCC countries is shown of the GCC countries to provide a brief compre- in Table 1. Usually, the GDP growth on an annu- hensive understanding of public finances in the al basis is the nominal GDP growth rate, which Gulf region. The study uses multivariate regres- is adjusted for inflation for the particular period. sion to analyze the impact of variables, such as Based on the data from national authorities and public revenue, non-oil revenue in %, public debt IMF projections, Oman took the lead in 2019, fol- and inflation, nominal GDP of the GCC countries. lowed by Kuwait and the UAE at 4.2%, 3.8% and Besides, the study also evaluates the validity of the 3% of real GDP growth, respectively. By compari- below mentioned regression equation: son, countries including Qatar, Bahrain and Saudi Arabia will lag behind. GDP = B(Public Rev)+ +Revenue (% of non-oil) - GDP at current prices is the market value of servic- es and goods produced in a country during a given - Public debt - Inflation, year. As Figure 1 shows, Saudi Arabia leads and is well ahead of other GCC countries in terms of GDP where B is a measure of volatility. at current prices, followed by the UAE and Qatar. While the nominal GDP is computed at the cur- 4. RESULTS rent market price, all the changes in market pric- es that would have taken place in that year as a There is an urgent need to study public finance, es result of deflation or inflation are included. The pecially in Gulf countries, where limited research crucial distinguishing feature between real values is being done to examine what the respective gov- and nominal values is that the real value of GDP ernments provide in the form of public goods and is adjusted for inflation, while the nominal values services, such as roads, military forces, health ser- of GDP are not. And as a result, the nominal GDP vices, education and many others. At the same would often be higher than the real GDP. Table 1. Growth in real GDP (%) Source: international Monetary Fund dataset (average 2000-2014 to 2019) (IMF, 2019). IMF projection Countries Average 2015 2000-2014 2016 2017 2018 2019 3.0 3.2 2.2 1.8 1.3 Bahrain Kuwait Oman Qatar Saudi Arabia United Arab Emirates GCC 5.1 4.8 3.7 11.2 4.1 4.8 4.9 2.9 -10 4.7 3.6 4.1 3.8 3.2 -2.5 -0.3 2.1 2.2 2.1 2.6 1.7 2.0 ISICININIS 2.3 3.8 4.2 2.7 1.9 3.0 2.6 -07 1.7 3.0 0.5 -0.2 3.6 2.1 1.9 Source: Author's plot World Bank and OECD data) 1960 1962 1964 1966 1968 1970 1972 1974 1976 1978 1980 1982 1984 1986 1988 1990 1992 1994 1996 1998 2000 2002 966 800 00G 2007 Vog 2004 2006 2008 2008 2010 2012 2014 2016 TOZ United Arab Emirates Bahrain -Kuwait Oman Qatar Saudi Arabia Figure 1. Gross domestic product (current USD) According to the IMF estimates and projections, except the oil division. Besides, this is the most nominal GDP in the GCC region will be USD critical macro-economic pointer that shows the 1,646 billion, and Saudi Arabia, followed by UAE, overall state of the national economy over the will lead the region at USD 759 and 428 billion, re- consecutive years. According to the IMF esti- spectively (see Table 2). mates and projections, Qatar would lead the re- gion in terms of non-oil GDP annual percentage Also, as an indicator, it measures the real annu- change at 4.1, followed by Oman and the UAE by al economic growth of all economic segments 2019 (see Table 3). Table 2. Nominal GDP (USD billions) Country 2015 2000-2014 20.5 103.3 Source: International Monetary Fund dataset (average 2000-2014 to 2019). Average IMF projection 2016 2017 2018 2019 31.1 32.2 34.9 37.8 39.7 114.6 110.9 120.4 135.3 140.1 68.9 66.8 74.3 164.6 152.5 1663 183.8 1939 6543 644.9 6938 749.0 7592 3579 348.7 377.4 4118 427.8 1,391.5 1,356.0 1,4571 1,599.4 1,646.4 82.6 Bahrain Kuwait Oman Qatar Saudi Arabia United Arab Emirates GCC 85.6 92.9 436.3 2419 940.7 Table 3. Oil exports: growth in crude and non-crude GDP (%) Country 2000-2014 7.4 Bahrain Kuwait Oman Qatar Saudi Arabia United Arab Emirates GCC Source: International Monetary Fund dataset (average 2000-2014 to 2019). Average IMF projection 2015 2016 2017 2018 2019 Non-oil GDP 3.6 40 4.4 3.6 2.8 0.0 2.0 2.5 3.0 3.0 4.3 1.5 2.0 3.0 3.5 8.2 S.6 4.0 4.1 4.1 3.2 0.2 1.0 2.3 2.1 3.2 2.7 1.9 2.8 3.3 3.5 1.6 1.8 2.7 2.7 7.0 12.6 6.5 6.3 6.9 Table 3 (cont.). Oil exports: growth in crude and non-crude GDP (%) Country IMF projection 2018 2019 2000-2014 2016 2017 0.4 0.3 010 Bahrain Kuwait Oman Qatar Saudi Arabia United Arab Emirates GCC 40 1.4 10.4 2.1 25 29 Average 2015 oil GDP -0.1 -17 5.2 -0.5 5.3 5.4 4.0 -0.1 2.3 2.1 -1.0 3.6 -2.2 -6.0 -2.8 0.2 -3.0 -2.5 -2.8 0.0 1.0 1.0 0.9 0.0 0.6 4.5 S.O 1.2 1.7 24 2.2 2.9 4.2. Public revenue regard, the GCC would still be dependent on oil and gas as projected by the World Bank and the Public finance is supposed to directly support IMF. However, Table 4 shows that Saudi Arabia public service delivery by increasing public reve- would lead in terms of crude oil production at nues while minimizing the associated public risks, 10.15 million barrels per day and Qatar would lead thereby ensuring fiscal sustainability (Liu & Li, in the natural gas production 4.29 among all the 2017). Due to the lack of data, 2011 had to be cho- GCC countries. sen. Figure 2 shows that Kuwait leads the rest of GCC countries in terms of government revenues 4.3. Consumer price inflation (GDP percentage), followed by Saudi Arabia and Oman. While the rest of the GCC members, in- Alsamara, Mrabet, and Dombrechtb (2018) have cluding Qatar, the UAE and Bahrain, still lagged found an unequal influence of import cost on in- behind. flation. As Table 5 shows, Bahrain will face the highest price rises, followed by Kuwait in 2019, At present, Gulf countries are not facing any signif- which will be a matter of grave concern for the re- icant problems due to the continuing natural gas spective governments. and crude oil production. However, in the long run, the key for a production and diversification 4.4. Public expenditure that is sustainable for the GCC would reduce the dependence on public revenue from the gas and Public expenditure is a financial outlay made by oil sectors. It was suggested that the Singapore de- the government of a particular country to achieve velopment model be used as it is characterized as the collective needs and desires, such as public the most desired model for a well-diversified ser- services, government salaries, infrastructure, etc. vice-oriented economy (Cummings, 2018). In this In GCC countries (see Figure 3), Kuwait was the Source: Author's plot (World Bank national accounts data). 80 70 60 50 40 30 20 10 0 1990 1991 1992 1993 1994 # 1995 1996 1997 1998 1999 2000 2001 2002 2003 2004 2005 2006 Bahrain Kuwait Oman Qatar Saudi Arabia United Arab Emirates Figure 2. Government revenue (% of GDP) Table 4. Oil and natural gas production (million barrels/day) Country 2.86 2.95 Bahrain Kuwait Oman Qatar Saudi Arabia United Arab Emirates GCC Source: International Monetary Fund dataset (average 2000-2014 to 2019). Average IMF projection 2000-2014 2015 2016 2017 2018 2019 Oil production 0.20 0.20 0.20 0.20 0.20 0.20 2.44 2.71 2.71 2.83 0.95 0.98 1.01 0.97 0.97 1.02 0.74 0.64 0.65 0.61 0.61 0.62 8.78 10.19 10.46 10.01 10.05 10.15 2.42 2.88 3.03 2.93 2.93 3.02 15.43 17.74 18.30 17.43 17.47 17.83 Natural gas production 0.26 0.37 0.37 0.37 0.38 0.22 0.26 0.27 0.24 0.24 0.25 0.50 0.67 0.68 0.73 0.73 0.79 1.88 3.93 3.97 4.17 4.24 4.29 1.59 2.01 2.10 2.20 2.25 2.33 0.84 1.02 1.05 1.05 1.05 1.05 4.86 8.26 8.44 8.77 8.90 9.11 028 Bahrain Kuwait Oman Qatar Saudi Arabia United Arab Emirates GCC Table 5. Consumer price inflation (average year, %) Country Bahrain Kuwait Oman Qatar Saudi Arabia United Arab Emirates GCC 2000-2014 1.7 3.2 2.5 4.3 2.2 4.1 3.0 Source: International Monetary Fund dataset (average 2000-2014 to 2019). Average IMF projection 2015 2016 2017 2018 2019 1.8 2.8 1.4 2.9 49 3.7 3.5 1.5 2.5 3.7 0.1 1.1 1.6 2.5 3.5 1.8 2.7 0.4 3.9 3.5 1.3 2.0 -0.9 3.7 2.0 4.1 1.6 2.0 4.2 2.5 2.0 2.1 0.2 3.6 2.5 Source: Author's plot (World Bank & OECD data) 250 200 150 100 50 0 1990 1991 1992 1993 1994 1995 9661 1997 2000 2001 2002 2003 2004 2005 2006 2007 Bahrain Kuwait Oman Qatar Saudi Arabia United Arab Emirates Note: Government expenditure includes interest as a share of GDP. Figure 3. Government expenditure (% of GDP) leader in government expenditures (% of GDP) in and Saudi Arabia. However, the UAE would be the the early nineties, and then for decades, almost only country in the region that has the lowest pub- all GCC countries were in the range of 50 to 2011. lic debt to GDP ratio at 19%. Also, according to Al-Faris (2002), country's in- come is an extrapolative factor for the growing 5. DISCUSSION role of the government, and empirical investiga- tions do not support the hypothesis that public spending causes revenue for the country. According to the IMF estimates, the GCC zone would have a nominal GDP of USD 1,646 billion, Public expenditure, especially in the education and Saudi Arabia, following by the UAE, would sector, will have long-term beneficial results for have a nominal GDP of USD 759 billion and USD GCC countries. Studies were conducted that sug- 428 billion, respectively. Also, as mentioned in the gested an educational institution that would facil- above sections, Bahrain faces the highest price ris- itate frequent industrial visits and promote stu- es, followed by Kuwait for 2019, and this is a mat- dents to have live projects. According to Pandow ter of grave concern for these governments. and Salem (2020), the implementation of these recommendations would augment the employa- With regard to public expenditure in the GCC bility of the youth. countries, as can be observed from the above, Kuwait leads in terms of government expenditure 4.5. Public debt (% of GDP) in the early nineties, and then over dec- ades, almost all GCC countries are in the range of Public debt is a financial obligation of the govern- 50 till 2011. Since 2019, Bahrain has cross public ment. Pandow (2018) suggests that there is a little debt to the tune of 102 percent of GDP, which will indication that public debt has a causative impact be the highest in the Gulf region. By comparison, on the economic growth and is significant in jus- the rest of the countries" public debt will remain tifying that the undesirable relationship between at the two-digit figure and peak at 52% of GDP in growth and debt is often used to defend the poli- the case of Qatar, followed by Oman, Kuwait and cies that assume debt has a negative causative im- Saudi Arabia. However, the UAE would be the on- pact on the development of a country. ly country with the lowest public debt to GDP ra- tio at 19%. Besides, as is evident from Table 6, by 2019, Bahrain would cross public debt of 102 percent of As Figure 4 shows, lower crude prices rendered by GDP, which will be the highest in the Gulf region the GCC economies demand an urgent attention and would be a matter of grave concern for the of policy makers so to rely less on the public sector government of Bahrain. By comparison, the rest as the key driver of growth. of the countries' public debt will remain at the two-digit figure, with the highest at 52% of GDP The descriptive statistic of each variable can be in the case of Qatar, followed by Oman, Kuwait found in Table 7. According to the table, the mean Table 6. Public gross debt (% of GDP) Source: International Monetary Fund dataset (average 2000-2014 to 2019). Country 2017 90.3 20.6 Bahrain Kuwait Oman Qatar Saudi Arabia United Arab Emirates 2000-2014 28.3 13.4 116 30.9 36.5 11.0 Average 2015 66.0 4.7 15.5 34.9 5.8 18.7 2016 81.5 9.9 33.3 46.5 13.1 20.7 IMF projection 2018 2019 94.9 102.0 26.7 46.8 48.3 SS.4 52.0 20.0 23.8 19.0 19.3 . 44.2 540 17.3 19.5 Table 7. Descriptive statistics of each variable used in the study Source: Author's analysis Statistics GOVERNMENT TOTAL_REVENUE NOMINAL_GDP Mean CONSUMER PRICE INFLATION 2.507665 2.502184 4.900021 -0.952273 1.288274 -0.389216 2.886063 0.929408 0.628635 90.27595 58.13282 36 34.21927 20.49266 66.52833 15.57131 12.82574 0.761882 Median Maximum Minimum Std. dev. Skewness Kurtosis Jarque-Bera Probability Sum Sum Sq.dev. Observations 15.35833 20.74846 87.31866 -64.41118 32.14934 -0.403206 3.265735 1.091374 0.582348 S52.9999 36175.30 36 REVENUE PERCENT_OF NON OIL 16.37906 14.45349 34.08851 4.027559 8.623919 0.421478 2.185420 2.061174 0.356797 589.6102 2603.019 TOTAL GOVERNMENT GROSS DEBT 35.23900 27.48876 102.0100 4.663454 25.59878 1.154649 3.524359 8.411717 0.014908 1268.604 22935.41 36 2.911298 3.494586 0.174245 1231.894 S757.490 36 26 Table 8. Multivariate regression analysis Source: Author's analysis Probability 0.0000 15 35833 32.14934 Summary Coefficient Std. error t-statistic C1251 36.72694 2.191276 16.76053 R-squared 0.832755 Mean dependent var Adjusted R squared 0.832755 S.D. dependent var Note: Dependent Variable: NOMINAL_GDP Method: anel Least squares NOMINAL_GDP =C(GOVERNMENT _TOTAL_REVENUE) + REVENUE_PERCENT_OF_NON_O- -TOTAL_GOVERNMENT_GROSS_D-CONSUMER_PRICE_INFLATION Besides, VAR model specifications used in this paper can be as follows: VAR model: NOMINAL_GDP =C(1,1). NOMINAL_GDP(-1)+C(1,2). NOMINAL_GDP(-2) + C(1,3)+C(1,4)-CONSUMER_PRICE_INFLATION + C(1,5)-GOVERNMENT_TOTAL_REVENUE + C(1,6). REVENUE_PERCENT_OF_NON_OL + C(1,7)- TOTAL_GOVERNMENT_GROSS_DEBT Table 9. Vector auto-regression estimates Variables NOMINAL_GDP-1) NOMINAL GDP-2) C CONSUMER_PRICE_INFLATION GOVERNMENT_TOTAL_REVENUE REVENUE PERCENT OF NON OIL TOTAL GOVERNMENT GROSS DEBT F.statistic Source: Author's analysis. NOMINAL_GDP 1.49E-15 (1.1E-15) [1.41211) 1.46E-16 7.7E-16) (0.18909 -2.62E-13 (1.1E-13) (-2.42507 4.87E-15 (1.2E-14 0.40170 1.000000 (3.0E-15) 3.4+14) 1.000000 12.7E-15) 3.8e-141. -1.000000 (1.SE-15) -6.7e+14) 9.00E+29 Note: Standard errors in (), and t-statistics in (). The study also employed vector auto-regression es- Johansen's Trace and Maximum Eigenvalue tests timates to measure the equation set above; Table 9 have been used to check the co-integration be- show the details. tween variables. Test results can be found in Table None Source: Author's analysis. Unrestricted cointegration rank test (trace) Hypothesized Trace 0.05 No. of CES) Eigenvalue Statistic Critical value Prob. 1.000000 641.4874 3.841466 0.0000 Unrestricted cointegration rank test (maximum eigenvalue) Hypothesized Max Eigen 0.05 No. of CES) Eigenvalue Statistic Critical value Proba None 1.000000 641.4874 3.841466 0.0000 Note: Max-eigenvalue test indicates 1 co-integrating egn(s) at the 0.05 level, * denotes rejection of the hypothesis at the 0.05 . level, **Mackinnon-Haug-Michelis' (1999) p-values. 10. Therefore, the variables are assumed to have a critical value of 3.84 with a p-value of 0.000 at a 5% long-run relationship having a trace stat of 641, a significance level. CONCLUSION Based on the above analysis, it has been concluded that the consumer price inflation, total government revenue, revenue (percent of non-oil) and absolute government gross debt have a statistically significant influence on the GDP of the select countries. Thus, it was found that the variables, which include infla- tion, government revenue and public debt, have a definite role and influence the nominal GDP of the GCC economies. The study also points to more robust evidence for a long-term relationship between independent varia- bles, which include inflation, public debt and revenue, and the dependent variable, which in this case is nominal GDP Besides, an upward trend in expenditures was found in all GCC economies, which is necessary as long as expenditure are effectively utilized for productive purposes. Also, the focus should be on augmenting public revenue generation and making economies less dependent on oil revenues. The study's findings indicate that GCC countries need to make substantial efforts to address the non-oil growth, as suggest- ed by Gill, Izvorski, Eeghen, and De Rosa (2014), and Cherif and Hasanov (2014). Moreover, diversifica- tion and promotion of the private sector needs to be stressed, and this is consistent with the findings of Moradbeigi and Law (2016), and Hakro and Pandow (2019). Since this paper analyzes and situates GCC countries in terms of public revenue, expenditure, inflation and public debt, other constituents of a public fiscal management structure, such as public financial ad- ministration and federal finance, were not included in the study. The time period is also limited in this study. Further research can be improved by incorporating public financial administration and federal finance dimensionsStep by Step Solution
There are 3 Steps involved in it
Step: 1

Get Instant Access to Expert-Tailored Solutions
See step-by-step solutions with expert insights and AI powered tools for academic success
Step: 2

Step: 3

Ace Your Homework with AI
Get the answers you need in no time with our AI-driven, step-by-step assistance
Get Started


