Question
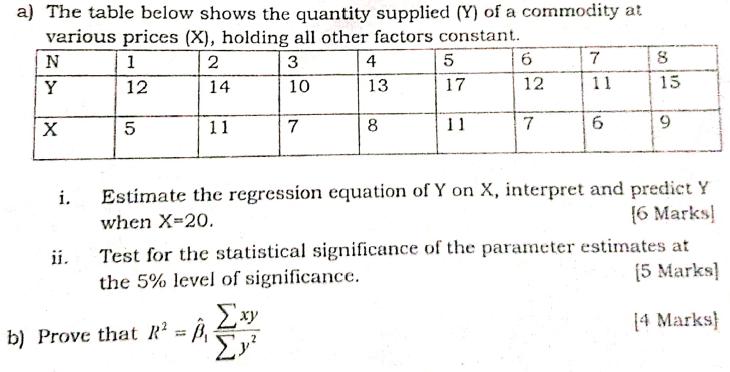
a) The table below shows the quantity supplied (Y) of a commodity at various prices (X), holding all other factors constant. N 1 2

a) The table below shows the quantity supplied (Y) of a commodity at various prices (X), holding all other factors constant. N 1 2 3 4 5 6 7 8 Y 12 14 10 13 17 12 11 15 X 5 11 7 8 11 7 6 9 i. ii. Estimate the regression equation of Y on X, interpret and predict Y when X=20. [6 Marks] Test for the statistical significance of the parameter estimates at the 5% level of significance. xy b) Prove that R = [5 Marks] [4 Marks]
Step by Step Solution
3.39 Rating (152 Votes )
There are 3 Steps involved in it
Step: 1

Get Instant Access to Expert-Tailored Solutions
See step-by-step solutions with expert insights and AI powered tools for academic success
Step: 2

Step: 3

Ace Your Homework with AI
Get the answers you need in no time with our AI-driven, step-by-step assistance
Get StartedRecommended Textbook for
Operations management processes and supply chain
Authors: Lee J Krajewski, Larry P Ritzman, Manoj K Malhotra
9th edition
9788131728840, 136065767, 8131728846, 978-0136065760
Students also viewed these Economics questions
Question
Answered: 1 week ago
Question
Answered: 1 week ago
Question
Answered: 1 week ago
Question
Answered: 1 week ago
Question
Answered: 1 week ago
Question
Answered: 1 week ago
Question
Answered: 1 week ago
Question
Answered: 1 week ago
Question
Answered: 1 week ago
Question
Answered: 1 week ago
Question
Answered: 1 week ago
Question
Answered: 1 week ago
Question
Answered: 1 week ago
Question
Answered: 1 week ago
Question
Answered: 1 week ago
Question
Answered: 1 week ago
Question
Answered: 1 week ago
Question
Answered: 1 week ago
Question
Answered: 1 week ago
View Answer in SolutionInn App


